The Rack Was Stable, but the Fans Were Spending Too Much Power
An anonymized AI-infrastructure integrator wanted to reduce fan energy and acoustic output during inference and partial-load operation without sacrificing the thermal margin needed for a sudden GPU workload step.
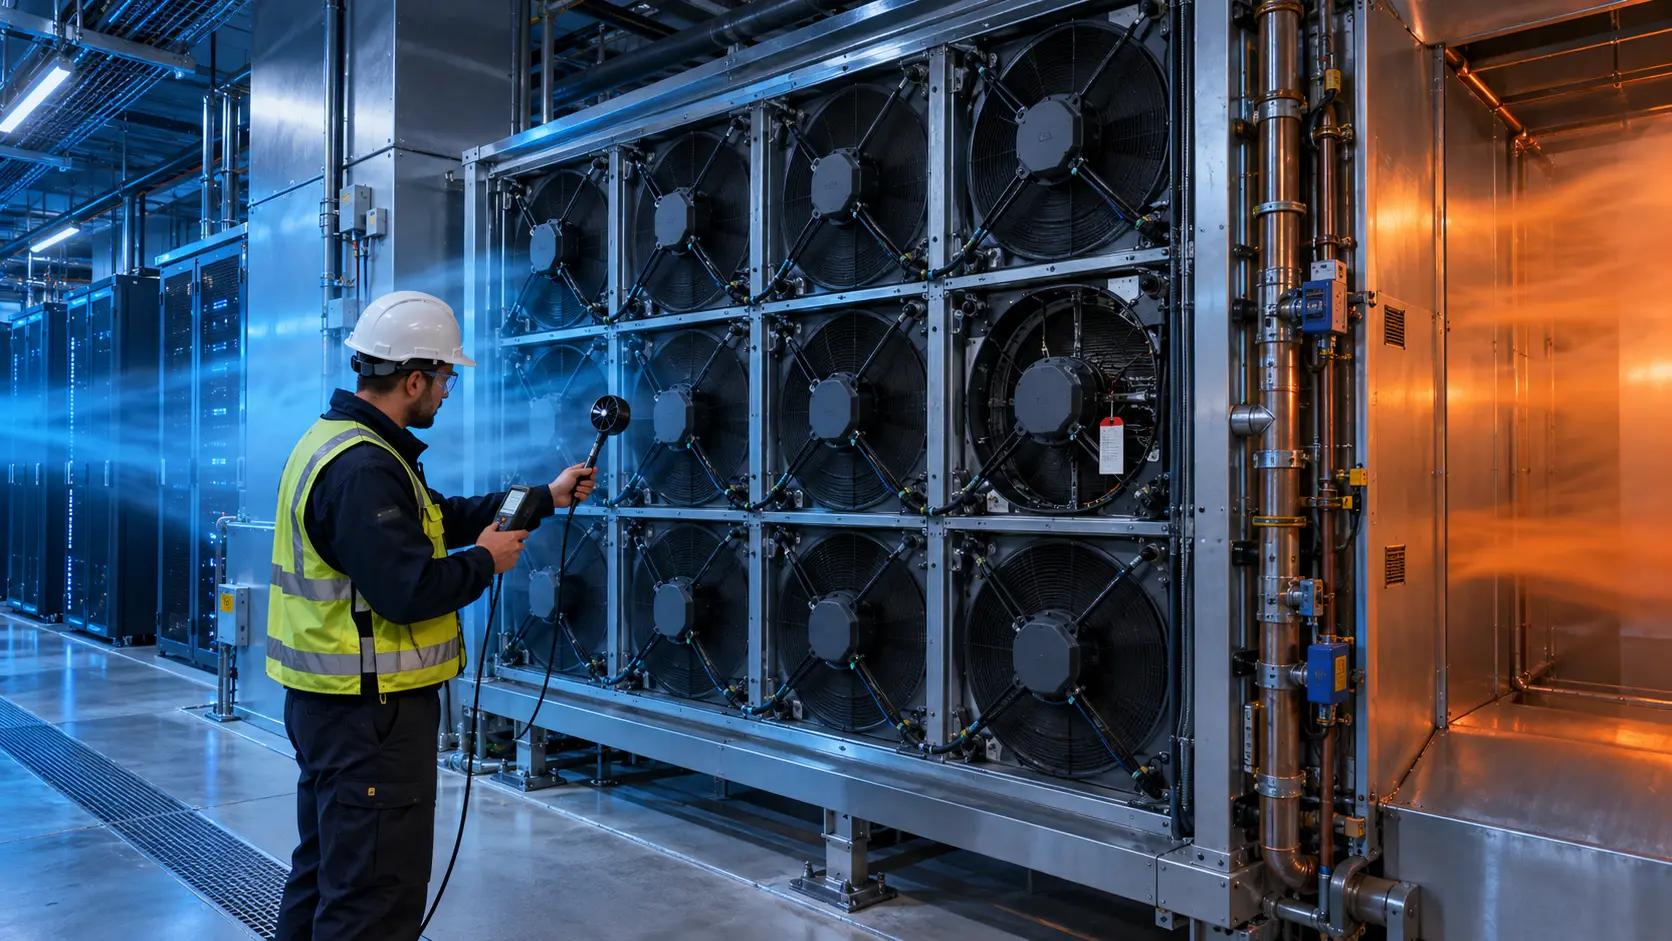
The rack did not have one fixed thermal condition. Idle, inference, training and recovery states produced different heat loads, inlet temperatures and fan commands. A conservative control curve kept the hottest component safe, but it also drove every fan harder than necessary during lower-load periods.
MEGA Tech reviewed the fan tray, installed pressure path, PWM response, inlet sensors, workload profile, noise target and thermal limits. The goal was not to claim a universal energy saving. It was to build a control-and-fan sample that could be compared at the same rack load and the same installed operating point.
The customer identity and released acceptance values remain confidential. Values marked illustrative are engineering examples, not customer test results.
The Engineering Hook: Lower RPM Is Not Automatically Lower Risk
Fan affinity laws explain why speed changes matter, but the installed rack still decides whether a lower command delivers enough useful airflow.
For a geometrically similar fan in a comparable operating region, airflow is approximately proportional to speed, pressure to speed squared and power to speed cubed. These relationships are useful for screening, not a substitute for the measured P-Q curve. A fan at 80% speed may use roughly 0.8 cubed, or 51%, of the reference power in an idealized comparison, but the rack temperature and pressure duty may not scale so neatly.
The Department of Energy notes that raising server inlet temperature can increase server fan speed and fan power significantly, while ASHRAE describes workload-based control and fan zones as ways to balance component temperature, acoustics, reliability and energy. The design question is therefore not ‘what is the lowest RPM?’ It is ‘what is the lowest stable duty that protects the limiting load in this installed path?’
The control curve was reviewed with the fan sample. Minimum stable PWM, startup behavior, feedback resolution, temperature filtering and hysteresis were treated as part of the cooling solution rather than firmware details left for later.
The Problem in Operation: One Conservative Curve Hid Four Different Duties
The original controller used a safe but broad speed curve that reacted to the highest observed temperature even when the rack load had already fallen.
The integrator logged rack power, GPU or CPU utilization, inlet temperature at multiple heights, component temperature, fan PWM, FG or RPM, current, acoustic level and facility supply condition. Each state was held long enough to reach a repeatable thermal condition before the command was changed.
At idle, the fan command remained above the minimum stable region because the controller had no verified lower boundary. During inference, a short workload burst caused a rapid step to a high command. During training, the command was appropriate, but the transition back to inference created hunting because the temperature filter and hysteresis were not aligned with the rack thermal time constant.
The team therefore separated three questions: what airflow is needed at steady load, how much headroom is needed for a power step, and how quickly the fan must recover after a hot event. A single maximum-speed rule could not answer all three.
Interactive: Watch the Control Point Move Across Four Load States
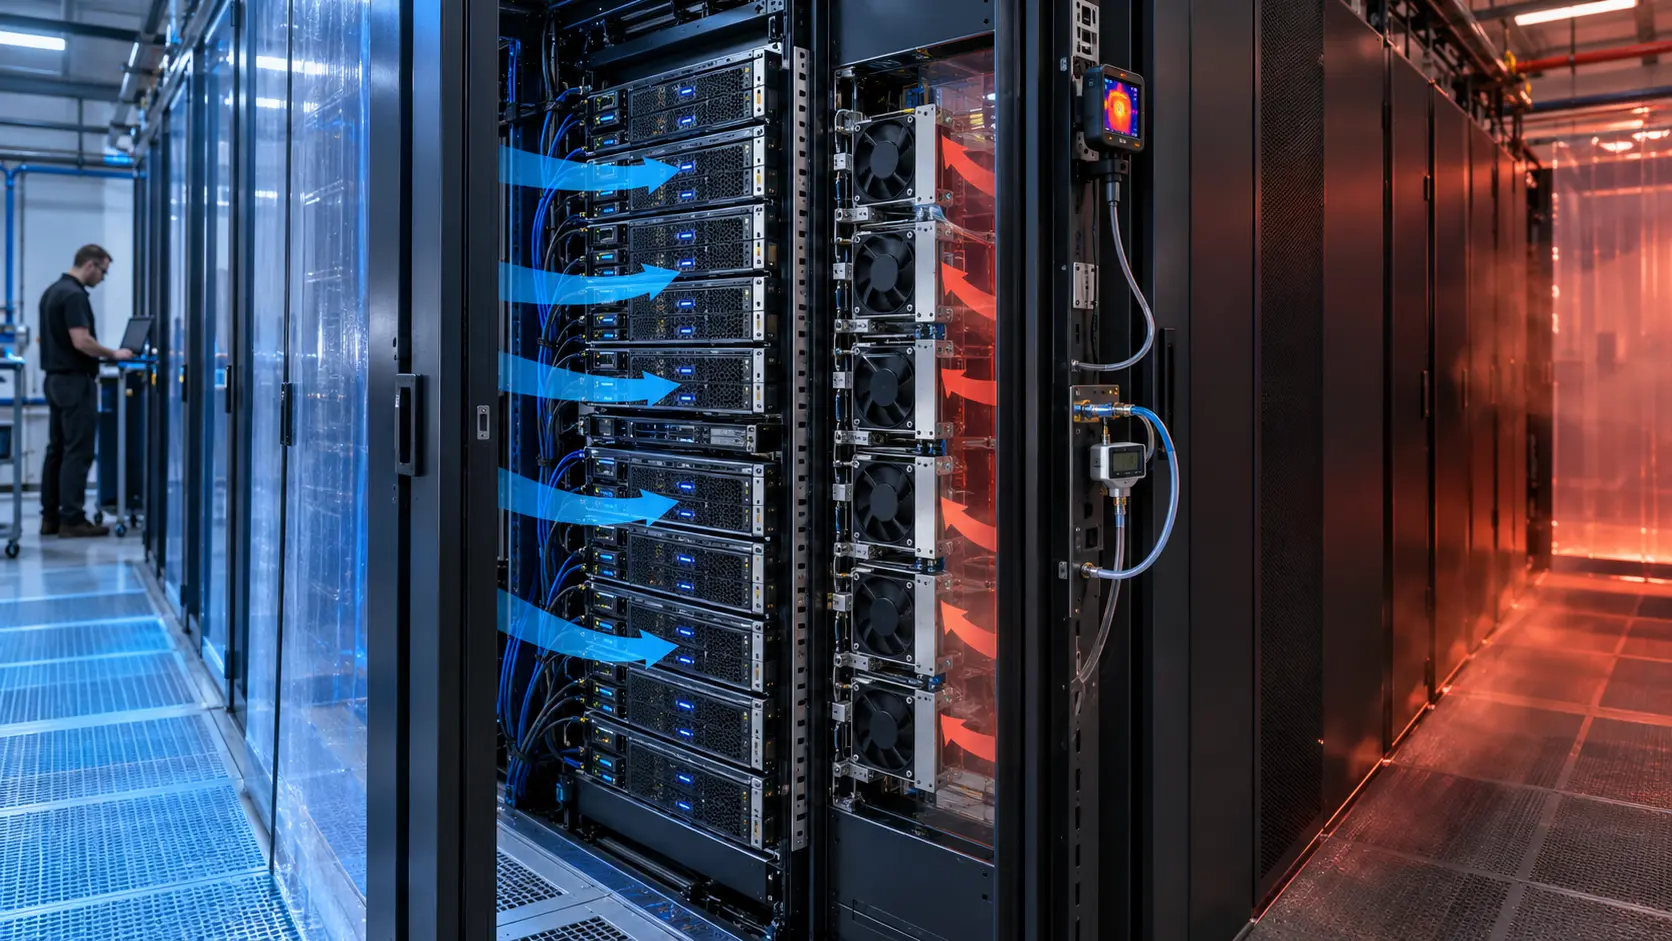
The animated schematic compares the fan command, rack heat load and thermal margin as the workload changes.
The figure is qualitative, not CFD and not a measured fan map. It shows why an operating point should be recorded with the workload state. A lower command can be valid at idle and invalid during a training step even when the fan RPM looks normal. Conversely, maintaining a high command after the thermal event has passed can increase power and noise without improving the limiting temperature.
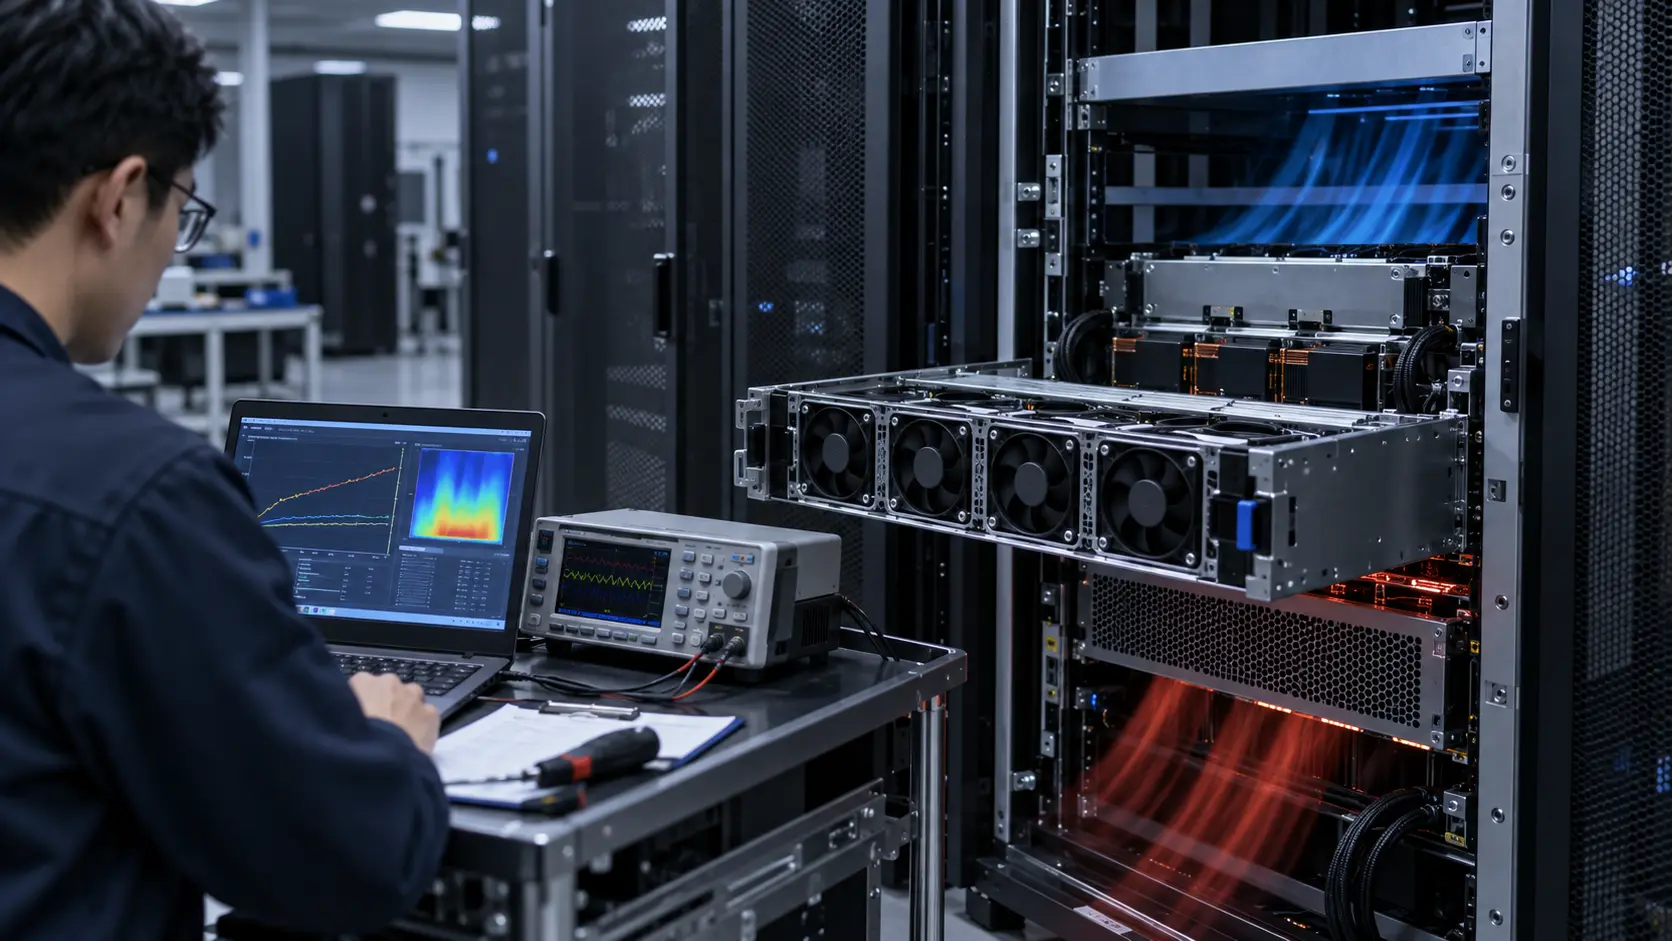
The test sequence used four repeatable states and recorded the command, feedback, power, pressure and temperature together. The controller was not accepted from a screenshot of PWM alone; it was accepted from a time-aligned record of the installed thermal response.

Sample 01: Establish the Lowest Stable Duty
The first sample task was to find a lower operating boundary that did not create startup failures, feedback loss or unstable control.
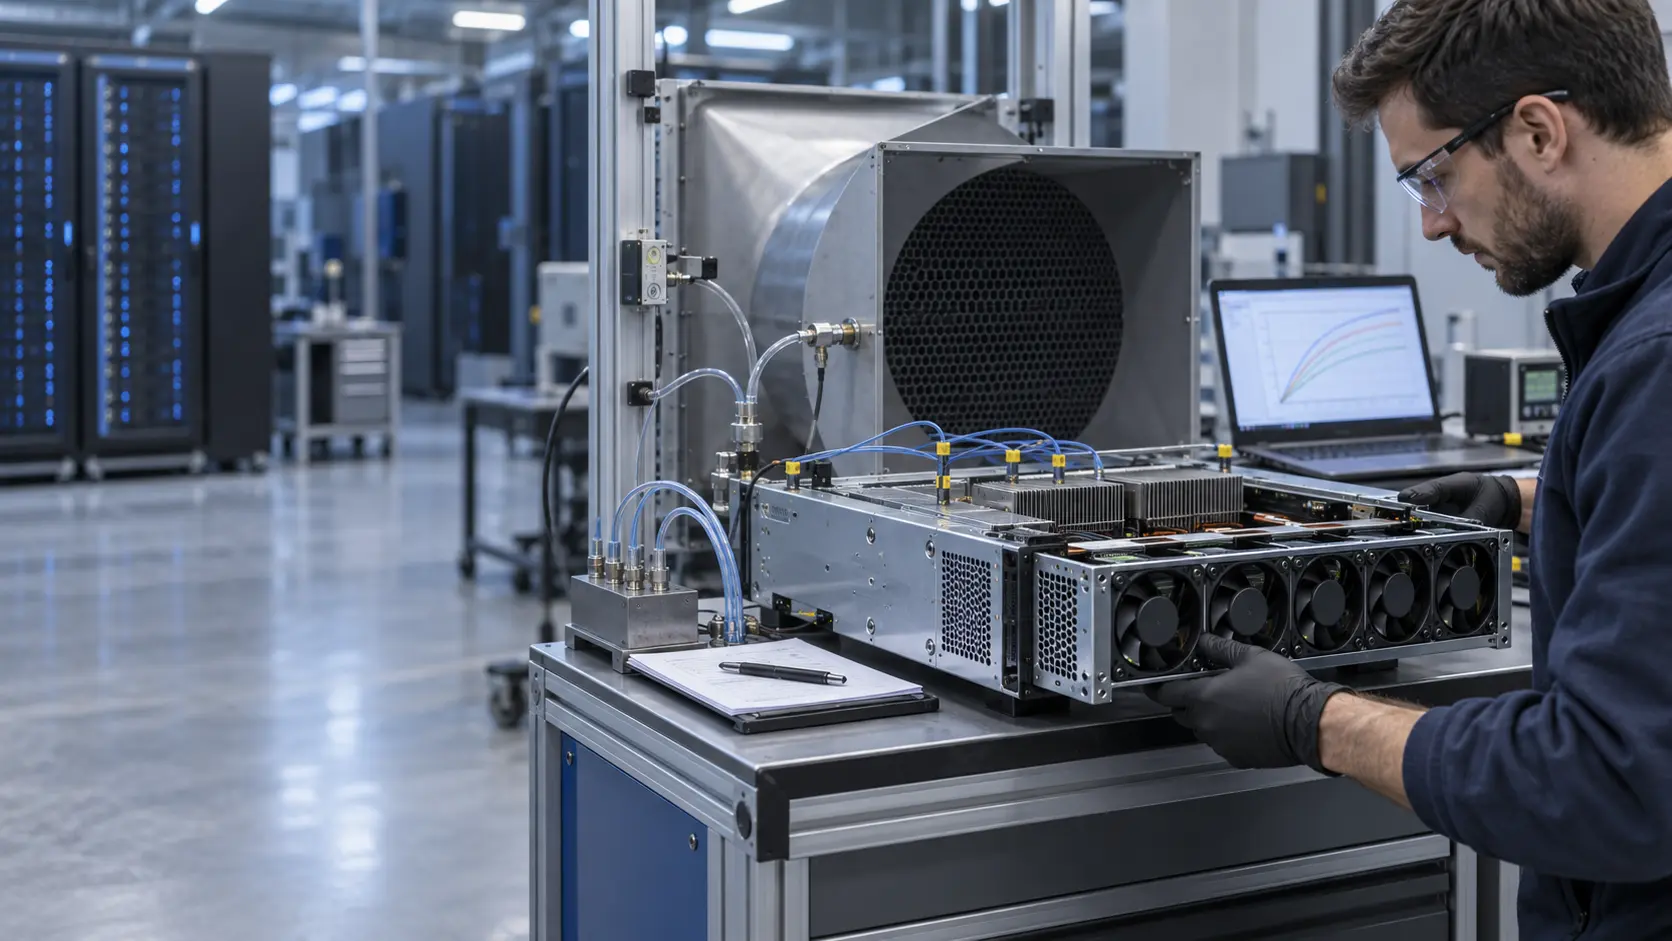
The fan sample was checked at the declared voltage tolerance and at the tray pressure condition. The test recorded minimum stable PWM, restart after a short stop, FG pulse stability, current, vibration and acoustic behavior. The lower boundary was not selected from a free-air bench because the tray grille and heatsink restriction can move the fan into a different region of its curve.
A practical acceptance table included cold start, warm restart, command step down, command step up and one brief supply disturbance. The customer then chose a control floor above the measured unstable region. That floor is application-specific and should not be copied to another fan or tray.
MEGA Tech can tune the motor, electronics, bearing configuration and control interface around the required envelope. The useful deliverable is a reproducible sample with the interface and installed pressure documented.
Sample 02: Compare Fan Power With Thermal Margin
The second sample was compared using the same rack load, air path and acceptance sensor locations.
For an illustrative screening calculation, if a fan consumes 30 W at a reference speed and an idealized control point falls to 80% speed, the cubic affinity estimate is 30 × 0.8 cubed = 15.36 W. Four fans would move from 120 W to about 61.4 W in that simplified comparison. Actual electrical input can differ because motor efficiency, pressure duty, electronics and system resistance change with speed.
The rack result was not declared from the calculation. The test checked whether the lower duty preserved the limiting component temperature, inlet distribution and recovery margin. It also checked whether the lower flow increased recirculation or caused another fan zone to compensate.
This distinction matters for procurement. A lower-watt fan that cannot deliver the installed pressure is not an efficiency improvement. A higher-pressure fan that allows the controller to run a stable lower duty may be the better system choice, but only after the complete tray is measured.
Sample 03: Tune Step Response, Hysteresis and Noise
The control curve was shaped to protect the rack during a workload step without creating repeated speed hunting.
The integrator defined a normal band, a warning band and a recovery band around the limiting temperature. The sample was tested with a rapid workload step, a slower ramp and a load drop. The log captured the delay from the thermal event to the command change, the fan acceleration, the peak temperature and the time to return to the normal band.
Hysteresis prevented the fan from moving up and down around one threshold. A short moving average reduced sensor noise, but the filter was not made so slow that the fan reacted after the component had already reached its limit. The correct values depend on sensor location, component thermal mass and firmware ownership.
Acoustic measurements were taken at idle, inference and recovery. A system that saves energy at steady state but produces an objectionable tonal peak during every step still needs another iteration in blade, motor, PWM frequency or tray geometry.
Validation Result: Part-Load Efficiency Became a Controlled Trade-Off
The final sample gave the integrator a documented relationship between fan duty, rack power, component temperature, noise and recovery margin.
The release record included the rack load definition, inlet and component sensors, installed P-Q points, PWM curve, current, fan power, acoustic position, workload transition, maximum temperature and return-to-band time. It also separated customer acceptance values from illustrative engineering calculations.
The transferable lesson is that fan energy cannot be optimized independently from thermal control. The fan, heatsink, grille, rack airflow, sensor and workload controller form one loop. The correct control floor is the lowest verified duty that maintains the required thermal and fault margin in the real enclosure.
For replacement procurement, same frame size and voltage are only the starting point. The candidate must be compared at the actual rack pressure and across the load states that matter to the deployment.
How MEGA Tech Supports AI Server Fan Customization
MEGA Tech helps server and rack integrators tune custom DC fans around real load states instead of a single catalogue headline.
We can review compact DC axial fans and blowers, tray pressure, grille and cable losses, PWM and FG/RD signals, connector details, minimum stable speed, startup and restart behavior, vibration, acoustic limits, bearing and life targets, and small first-build quantities. We can also evaluate alternatives to Sanyo Denki, SUNON, Delta, NMB, ebm-papst and other installed brands when the operating point is defined.
Please provide rack or chassis heat load, airflow and static pressure at that airflow, temperature and altitude basis, fan size, voltage tolerance, quantity, PWM/FG/RD convention, connector, noise target, load profile, sensor positions, environment and life assumption. If data is incomplete, send the current fan part number, tray photos, rack layout and measured inlet or power logs.
Our scope is fan and air-path engineering, sample customization and comparative validation. We do not supply the customer's server firmware, DCIM/BMS, CRAH/CRAC, containment or facility safety design.
Engineer Questions About This Part-Load Case
Use these questions before changing a server fan curve or approving a lower-power fan sample.
Q: Can I reduce RPM by 20% and expect half the fan power? A: The cubic affinity estimate is a screening tool. Verify the motor, pressure path, operating point and electrical input.
Q: Is the lowest PWM value the best control floor? A: No. Use the lowest stable value that preserves startup, feedback, airflow, thermal and fault margin in the installed tray.
Q: Why can a cooler room increase server fan power? A: A control loop may respond to a sensor or component condition, and different airflow paths can change the fan operating point. Measure the server and rack, not only the room average.
Q: Should every fan zone use one curve? A: Not necessarily. ASHRAE describes fan zones as a way to match fan duty to the components most coupled to each zone.
Q: What should I send for a review? A: Send heat load, airflow and pressure, fan size, voltage, quantity, control, noise, load states, sensor positions, environment and life target.
Q: Can MEGA Tech provide a custom sample? A: Yes. We can review the installed duty and support a sample comparison before production release.
Need an AI Server Fan Power and Thermal Review?
Send the rack heat load, installed airflow and static pressure, fan size, voltage, PWM/FG/RD interface, load profile, noise target and containment constraints. MEGA Tech will review the operating point before recommending a sample.
Include the current fan model, fan-tray photos, rack layout, workload profile, inlet-temperature data, fan-power logs and any pressure or acoustic measurements available. This helps separate a fan problem from a sensor, control, tray or facility-airflow problem before the production BOM is locked.