What Is Static Pressure?
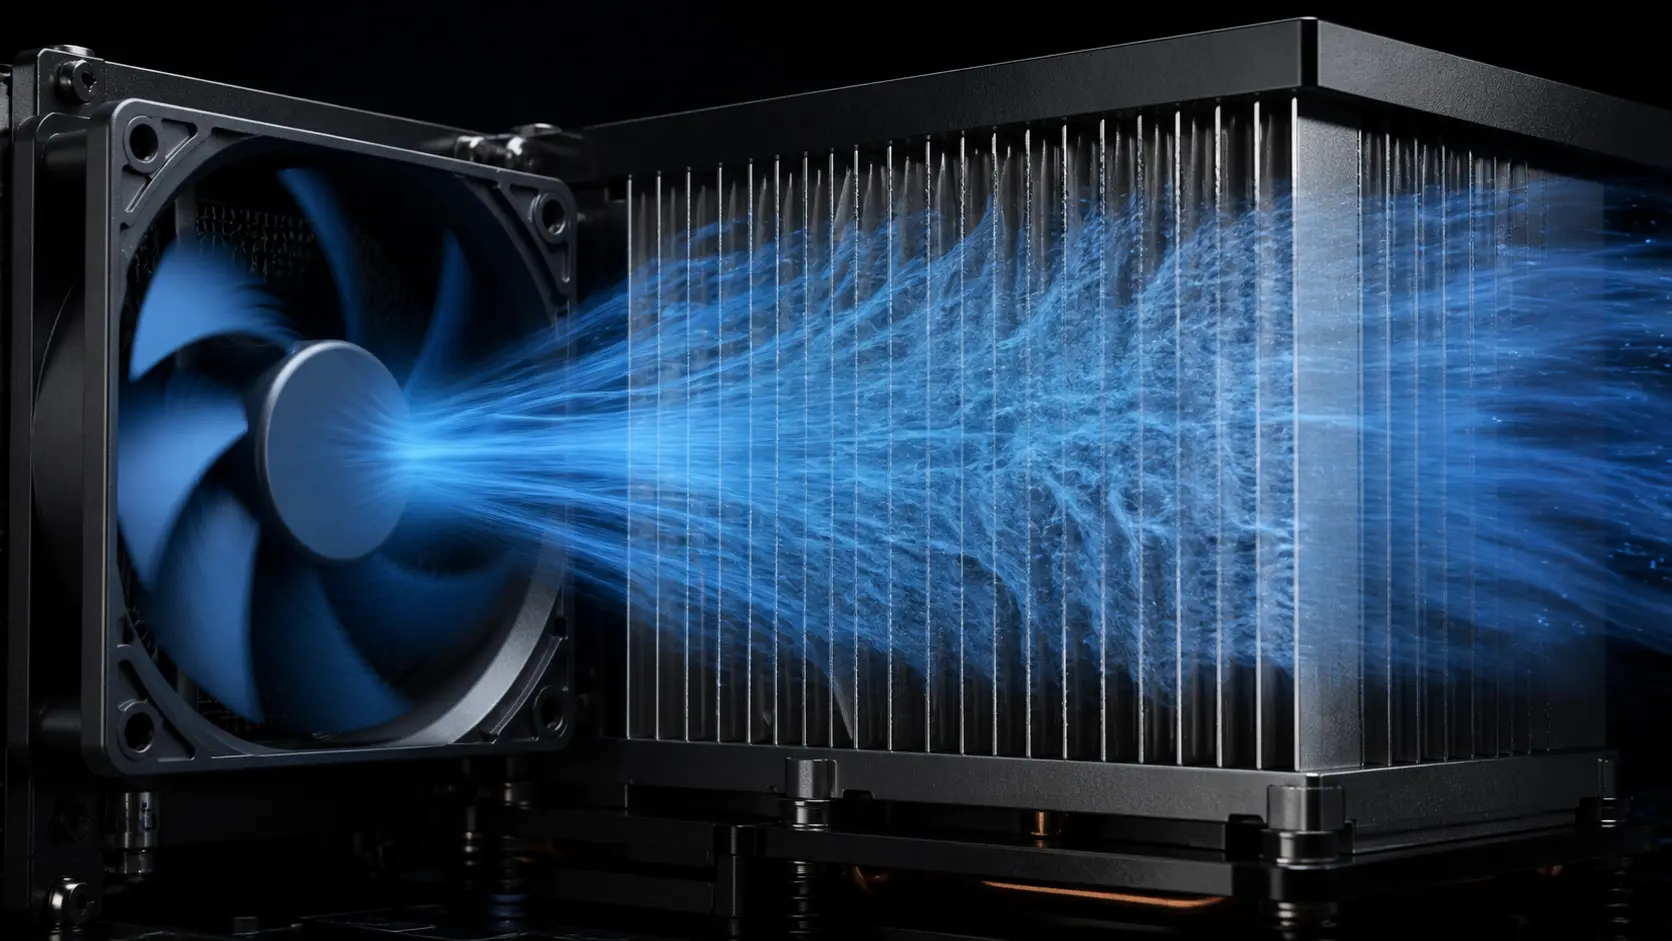
A fan does not just move air - it creates a pressure difference that drives air through the resistance of the product.
Static pressure is the pressure component measured relative to the surrounding air or system boundary. In a cooling assembly, the fan must generate enough pressure at the required airflow to overcome restrictions such as a filter, heatsink, grille, baffle or duct.
Engineers measure static pressure in pascals (Pa), millimetres of water column (mmH₂O), or inches of water column (inH₂O). One mmH₂O equals approximately 9.81 Pa, and 1 Pa equals approximately 0.004 inH₂O. These conversions matter when comparing fans from different manufacturers that quote different units.
There is no universal static-pressure value that makes a fan suitable for every enclosure. The useful question is how much pressure the fan can provide at the target airflow, in the intended speed, voltage and installation condition. Free-air CFM numbers on datasheets assume negligible external resistance; once a system imposes pressure drop, delivered airflow moves to a different point on the fan curve. A pressure value is meaningful only when its measurement planes, installation category, air density and test condition are also known.
Understanding static pressure bridges the gap between a headline datasheet number and the airflow that is actually available inside the enclosure.
Static vs Velocity vs Total Pressure
Airflow in a duct involves three distinct pressure components, and confusing them leads to incorrect fan selections and undersized cooling systems.
Total pressure is the sum of static pressure and velocity pressure. Static pressure is the pressure component measured at the system boundary, while velocity pressure represents the kinetic part associated with the moving air stream.
In a straight, unobstructed duct the velocity pressure stays roughly constant, so changes in total pressure come mainly from static pressure losses. At bends, filters, and grilles, both velocity and static pressure shift as the air changes direction or speed.
Fan test standards and datasheets may report static pressure or total pressure depending on the test arrangement. The difference matters when the inlet and outlet velocities are not equivalent, so always compare the same pressure definition, measurement planes, installation category and method across vendors. A static-pressure number copied from one test arrangement should not be treated as interchangeable with a total-pressure number from another.

- Static pressure — the pressure component measured at the system boundary
- Velocity pressure — the kinetic pressure associated with air velocity, proportional to the square of velocity
- Total pressure — the sum of static and velocity pressure
- Fan data may report static or total pressure, so verify the metric and test method before comparing fans
Where System Resistance Comes From
Every component the air passes through — from the inlet grille to the exhaust — adds resistance that the fan must overcome.
A system-resistance chain begins at the fan inlet, where the grille or dust filter forces air through narrow openings. Each perforation, mesh layer, and filter fibre creates a small pressure drop, and these drops add together in series.
Heatsink fin arrays are among the highest-resistance elements in electronics cooling. Narrow fin spacing and long fin length increase the pressure drop significantly, especially at high flow rates.
Duct bends, reducers, and long runs add friction and local losses. The magnitude depends on geometry, flow rate and area ratio, so do not insert a generic pressure-drop value into the design without a component curve, calculation or measurement.
The total system resistance is the sum of the pressure losses through the complete path. No single component dominates in all designs — the fan must be matched to the complete resistance profile, not just one element. Also check the fan's immediate inlet and outlet: uneven flow, swirl, nearby obstructions and abrupt transitions can create system effect that is not represented by a clean laboratory curve.

- Inlet grille and dust filter — first resistance in the chain
- Heatsink fin array — often the largest single contributor
- Duct bends and reducers — add friction and turbulence losses
- Exhaust grille or louvre — final restriction before ambient
- Total resistance = sum of path losses, plus any installation system effect
Pressure Measurement Is Part of the Specification
A pressure number without its measurement planes and test boundary is not enough to compare two fans.
Before comparing a static-pressure value, identify what the supplier measured: fan static pressure, fan total pressure, pressure rise across a component, or a local gauge pressure at one tap. Static pressure and total pressure differ by velocity pressure, so the difference becomes important when the inlet and outlet areas or air velocities are not similar.
The pressure-tap location also changes the result. A tap too close to a bend, grille, contraction, swirl or recirculation zone can measure a local condition rather than a representative plane. ISO 5802 includes pressure-plane location, velocity, temperature, density and rotational speed in its in-situ test procedure; those details are part of making an installed comparison repeatable.
For a product requirement, write the pressure target as a complete statement: required airflow, pressure definition, tap locations, air temperature or density, voltage, speed or control state, and the restrictions installed during the test. This prevents a fan from being approved against a pressure value that was measured under a cleaner or different installation than the customer's product.
- Name the pressure quantity: static, total, velocity or component pressure drop.
- Record pressure-tap locations and distance from bends, grilles and transitions.
- Keep airflow, voltage, speed, air density and installation category with the result.
- Use the same pressure definition and measurement boundary when comparing suppliers.
- Repeat the measurement after the fan, grille, filter or duct geometry changes.
Why Resistance Rises with Airflow
System resistance does not increase linearly with airflow — for a fixed geometry in the usual turbulent-flow range, doubling the airflow requires about four times the pressure drop.
For a fixed geometry and a flow regime where the usual loss-coefficient model is appropriate, the equation ΔP = KQ² captures the planning relationship: turbulence and friction losses scale with the square of velocity. Because volumetric flow rate is proportional to velocity in a fixed path, the same square-law is commonly applied to Q.
At low flow rates the system curve is relatively flat, and the fan faces little opposition. As flow increases the curve steepens sharply: a target of twice the airflow can require roughly four times the system pressure under the same geometry. This is a planning relationship, not a substitute for a measured component curve when the geometry or flow regime changes.
The interactive calculator below lets you set a known operating point, compute the system constant K, and then see how the required pressure changes when you adjust the target airflow. Enter a known flow rate and its corresponding pressure drop — the tool determines K, then generates a table and canvas plot showing the full system resistance curve.
Try adjusting the target airflow to observe how quickly the required pressure climbs. This is the primary reason installed CFM always falls below free-air CFM.
System Effect: When the Installed Fan Misses Its Curve
A clean laboratory curve is not a guarantee of the same installed performance. Poor inlet or outlet geometry can add an installation penalty before the air reaches the main restriction.
System effect is the performance loss created by disturbed flow at or near the fan. A tight elbow, abrupt transition, short outlet, uneven grille, nearby obstruction or swirl can produce a non-uniform velocity profile. The fan may still spin at the commanded speed, but the delivered airflow and pressure no longer follow the ideal test arrangement.
This is why a fan can appear correctly selected on paper and still underperform in the enclosure. The loss is not necessarily a defect in the motor or impeller; it can be an installation effect that changes the pressure distribution and increases turbulence. AMCA describes these losses as system effects, while ISO 5802 notes that site measurements need not match standardized-airway results when the fan connections and flow profile differ.
Before changing to a larger or faster fan, inspect the first fan-diameter of the inlet and outlet path. Add a straight approach where space permits, avoid placing a bend directly against the inlet, use a smooth transition instead of a sudden step, and provide enough open area at the grille. Then measure the installed operating point with defined pressure taps and airflow conditions.
- Avoid a close-coupled elbow or sharp step immediately upstream of the fan.
- Avoid outlet blockage, recirculation and an asymmetric grille pattern.
- Record the pressure measurement planes and whether the reported value is static or total pressure.
- Compare the clean bench result with the assembled product, not only with a catalogue maximum.
What Max Static Pressure Really Means
A datasheet lists two headline numbers — max airflow in CFM and max static pressure in mmH₂O — but they do not describe the same operating point.
Max static pressure, often called shutoff pressure, is the pressure reported near zero airflow in the specified test condition. No useful air moves through the product at that boundary, so it is not a cooling operating point.
Max airflow (free-air CFM) is the volume of air the fan delivers when there is zero resistance — no filter, no heatsink, no duct. This condition rarely exists in a real system.
Every actual operating point lies between these boundary conditions for a normal fan curve. The fan delivers less than free-air airflow because the system imposes resistance, and the pressure is below shutoff pressure because air is moving.
Selecting a fan based on max airflow alone is the most common mistake in thermal design. The fan must be evaluated against the system's actual resistance curve at the required operating point. The full P-Q curve is covered in the next article.

- Max static pressure occurs at zero flow (fully blocked outlet)
- Max airflow occurs at zero resistance (open inlet and outlet)
- Real operating point always lies between these two extremes
- Never use max airflow as a design target without considering system resistance
How Resistance and Fan Speed Change Performance
Fan affinity laws predict how airflow and pressure respond when rotational speed changes, giving engineers a quick way to estimate performance shifts.
The affinity laws compare corresponding points on the same fan family: airflow scales with speed, pressure with the square of speed, and power roughly with the cube. They are useful for estimating a new fan curve at another speed, but they do not mean that an installed fan will automatically double its delivered airflow when its command doubles.
Once the fan is installed, the system curve still decides the new operating point. Increasing speed raises the fan curve, while the product resistance remains; the actual intersection must be recalculated. This distinction matters in restrictive enclosures, where pressure capability may increase substantially while delivered airflow increases by a smaller amount.
Power consumption scales roughly with the cube of speed for corresponding fan conditions. Always verify motor temperature, current, controller limits and supply capacity before using a higher speed as a correction.
These laws apply as an engineering approximation to corresponding points on the same fan geometry under comparable air density, installation and control conditions. Expect deviations near stall, at very high speeds, with motor/controller limits and wherever the system geometry changes with flow. Use measured fan curves for final selection and production acceptance.
- Airflow is proportional to speed (linear relationship)
- Static pressure is proportional to speed squared (quadratic relationship)
- Power draw is proportional to speed cubed (cubic relationship)
- Use a supported PWM or voltage-control method to shift the fan curve while the system curve remains defined by the product
From Static Pressure to the Operating Point
Static pressure explains the resistance a fan must overcome; the P-Q curve explains what the fan can deliver — the operating point is where the two meet.
The system resistance curve (ΔP = KQ²) describes how much pressure the system demands at any given airflow. The fan curve (P-Q) describes how much pressure the fan can supply at any given airflow. Plotting both on the same axes reveals the operating point at their intersection.
A fan may be capable of 30 CFM at a low-resistance point on its curve, yet deliver only 18 CFM when the installed filter, heatsink and duct demand the available pressure at that flow. The operating point shifts along the fan curve until the fan's supply matches the system's demand.
Understanding this intersection is the foundation of proper fan selection. Article 04 covers fan P-Q curves in detail, including how to read them, how to overlay system curves, and how to choose between multiple fans for the same application.

- System curve — how much pressure the system needs at each airflow
- Fan curve — how much pressure the fan can provide at each airflow
- Operating point — the intersection of the two curves
- The next article explains how to read and apply fan P-Q curves
Engineer FAQ: Static Pressure in the Installed Air Path
Static pressure is meaningful only when it is tied to airflow, measurement condition and the resistance the fan must overcome.
Q: What does maximum static pressure tell me? A: It is the shut-off endpoint at zero airflow. It does not tell you the airflow available in your enclosure; read the fan P-Q curve at the system operating point.
Q: How do I estimate enclosure pressure drop? A: List grilles, filters, heatsinks, ducts, bends, cable bundles and outlet restrictions. Use supplier pressure-drop data or a first-pass system model, then replace the estimate with CFD or representative flow-bench measurement.
Q: Can I compare static-pressure values from different suppliers directly? A: Only when the pressure definition, airflow, voltage, speed, air condition, installation category and measurement planes are comparable. Otherwise treat the values as different test quantities until the boundary is reconciled.
Q: Where should pressure be measured? A: Define the measurement planes and tap locations relative to the fan, inlet, outlet and restriction. Installation effects, swirl and short straight lengths can distort a comparison between a bench result and the installed device.
Q: Does higher pressure always mean a better fan? A: No. A higher-pressure fan may consume more power, produce more noise or operate in an unstable part of an axial curve. Choose the fan that reaches the required airflow at the required pressure with acceptable margin.
Q: How should I handle a filter that becomes dirty? A: Treat the clean and loaded filter as different system curves. Use the supplier's pressure-drop data at the design flow, add a maintenance or loading condition where appropriate, and validate the fan at the worst credible resistance rather than only with a new filter.
Q: Does hot air change the pressure requirement? A: The enclosure resistance is primarily set by geometry and flow, but air density changes the fan's pressure and power relationship. State the air temperature and density used for the curve or test, and validate the operating point at the product's worst thermal condition.
Q: Why can a fan meet its datasheet curve but miss the installed target? A: The test arrangement may be cleaner than the product. Check system effect from bends, short transitions, obstructions, swirl and measurement planes before concluding that the fan rating is wrong.
Q: What should a supplier provide? A: Ask for the measured P-Q curve with voltage, speed, air density, units, test method and pressure definition, plus noise and power at relevant operating points. Also request the control-interface behavior, tolerances and the conditions for any bearing-life claim. Then verify the candidate in the actual enclosure.
Q: What should be in a fan acceptance test? A: Record airflow, pressure, voltage, current or power, speed, noise, air temperature and control state at the agreed operating point. Repeat with the representative grille, filter, heatsink and duct, and define pass/fail limits before the sample test.
- Tie every numerical answer to voltage, speed, temperature, mounting and test condition.
- Separate catalogue maximums, engineering estimates and measured application results.
- Use the FAQ to define the next measurement or sample-validation step.
From pressure requirement to a tested custom fan
Static pressure becomes useful when it leads to a fan configuration that is measured in the customer's real product.
MEGA Tech can start with the customer's system curve and pressure target, then review the heat load, airflow path, available space, noise limit, voltage, speed range, control signal, feedback, mounting and environment. This helps the team choose a fan around the loaded operating point rather than selecting by maximum static pressure or free-air CFM alone.
If a standard option does not provide enough pressure margin or does not fit the product interface, the fan can be customized around frame size and thickness, airflow and static pressure, speed, PWM, FG or RD feedback, connector and cable length, bearing choice, rotation direction, mounting and protection requirements. We can develop a practical sample for established products, replacement projects or early-stage equipment that needs a small first build.
The sample is tested with the representative filter, grille, heatsink, duct, baffles and controller. We verify the operating point, temperature rise, noise, power, control response, fault feedback and loaded-filter behavior, then refine the configuration with the customer. After approval, the measured curve and pressure margin become the baseline for reliable volume production.
- Define the pressure target at the required airflow and real system resistance.
- Customize pressure, size, speed, control, feedback, wiring, bearing and mounting details.
- Validate the sample with actual or representative restrictions.
- Carry the approved measured curve into stable production.