The Real Failure May Be Between the Shelves
A room can meet its temperature setpoint while the crop canopy still sees uneven air movement, humidity and heat removal.
In a multi-level vertical farm the crop does not experience the room average. Each shelf has its own inlet condition, canopy resistance, LED heat load and return path. A distant HVAC outlet can keep the room sensor inside its target range while a populated rack still contains low-velocity pockets.
That matters for leafy greens because air movement changes the boundary layer around the leaves, transpiration and the local temperature-humidity condition. Tip burn is not a fan-only diagnosis. Low air movement, high humidity, light load, crop density and nutrient conditions can interact to make the problem visible at the leaf edge, and the same symptom can appear on a shelf whose room sensor reads perfectly.
The engineering question is therefore not whether the selected fan has enough free-air CFM. It is whether the installed rack produces a repeatable crop-zone velocity and climate condition at the operating state that matters to the farm, and whether anyone can show that with a measurement.
- Separate room-average conditions from shelf-level conditions
- Treat fan placement, LED heat, canopy density and return path as one air system
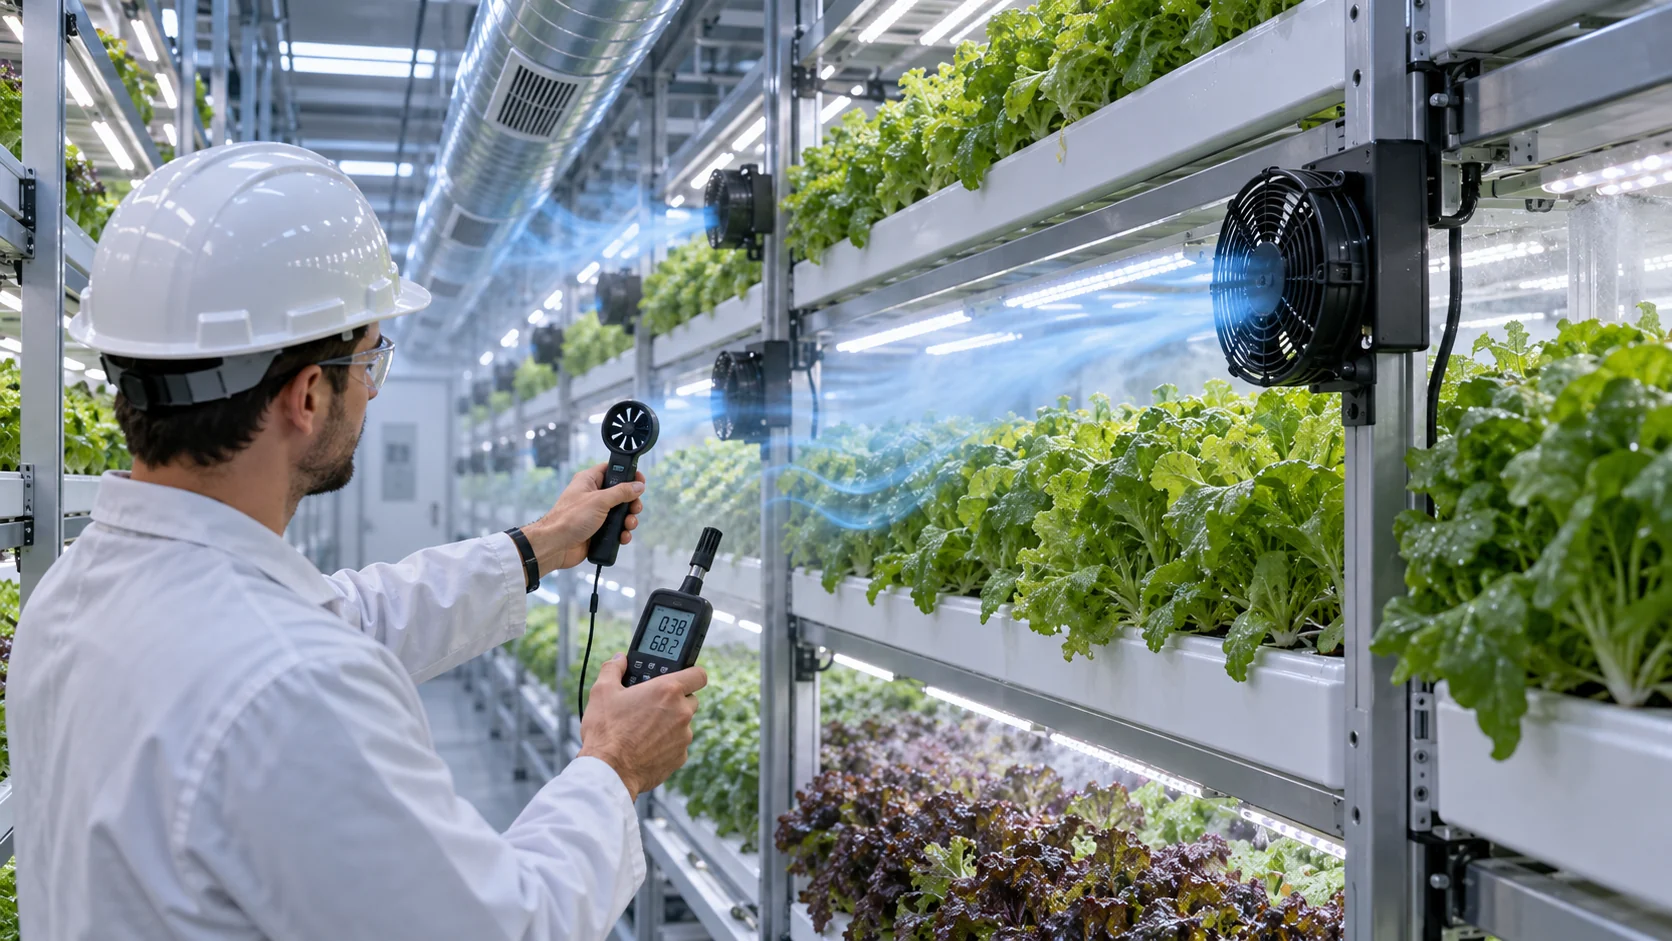
- Measure at the crop canopy instead of accepting a room sensor as proof
- Use crop-loss data to trigger an airflow investigation, not to assume a fan fault
What the Research Says About Canopy Velocity
The useful target is a measured range for the crop and growth stage, kept together with a spread limit rather than a single best number.
The strongest published signal is not a target speed, it is the size of the effect. In a study of lettuce under artificial light, raising canopy air speed from 0.23 to 0.75 m/s cut leaf boundary-layer resistance by 45 percent and raised sensible and latent heat flux by 40 and 46 percent. Tip burn appeared in the control bed and not under the multi-fan airflow. The same study reported a canopy mean of 0.75 m/s with a coefficient of variation of 65 percent, which is a useful reminder that a mean value and a uniform field are different claims (Lee et al. 2019, Journal of Thermal Biology).
A plant-factory CFD study reached a similar conclusion from the geometry side. Two perforated air tubes delivering vertical jets gave a mean canopy air speed of 0.42 m/s with a coefficient of variation of 44 percent, and the authors treated that spread as the design outcome rather than a side note. The paper also states the mechanism plainly: tip burn in lettuce is a calcium deficiency disorder that appears on inner and newly developing leaves when a stagnant boundary layer sits over them under high transpiration demand (Zhang, Kacira and An 2016, Biosystems Engineering 147).
Greenhouse practice has been solving the same problem for decades, and its numbers are a useful sanity check. Horizontal air flow guidance puts 50 to 100 feet per minute, or 0.25 to 0.51 m/s, at plant level, with total fan capacity near twice the floor area in CFM. The same guidance notes that 50 to 100 feet per minute is enough to keep night leaf temperature close to air temperature, which is what limits condensation on the leaf, and that fans spaced too far apart let the air mass short circuit and leave a dead air cold spot (UMass Extension, horizontal air flow fact sheet).
These published values are reference conditions, not a universal specification. Crop variety, canopy stage, light intensity, shelf spacing, humidity control and measurement height all change the correct acceptance band, and the two ranges above come from different geometries, crops and light loads. Use them to design the test, then set the acceptance limit from the crop recipe of the farm in front of you.
Setting the Acceptance Band From the Crop Recipe
The band comes from the crop and the growth stage, and it pairs a velocity range with a climate range.
Velocity on its own is not the acceptance criterion, because the reason air movement matters at the leaf is water and heat transport. Transpiration is driven by the vapour pressure deficit, so a defensible band states both. Cultivation guidance for leafy greens places the target vapour pressure deficit near 0.8 to 1.1 kPa during active growth and 0.4 to 0.8 kPa for propagation and rooting. An extension discussion of greenhouse climate for leafy greens and culinary herbs uses 0.65 to 0.9 kPa with 0.85 kPa as the optimum, and notes that leafy crops want a more humid space than fruiting crops because they have more leaf area to lose moisture from.
Leaf temperature is the second correction. Under LED load the leaf surface typically runs 1 to 2 degrees Celsius above the surrounding air, so a band written from air temperature alone can accept a leaf microclimate that is already too dry, or reject a shelf that is actually fine. Measure leaf temperature, or record the offset you assumed, and keep it with the band.
Night is a separate case. The same relative humidity at a lower night air temperature represents a different absolute moisture content, and a lower night vapour pressure deficit reduces the risk of condensation on leaf surfaces and on glazing. Keep the night limit in the record instead of reusing the day value.
Write the accepted band into the release record with the crop, cultivar, growth stage, measurement height, light state and shelf position that produced it. A band without those qualifiers cannot be compared with the next sample, and a sample that cannot be compared is not evidence.
| Variable | Where it is measured | Example band for leafy greens | What it rules out |
|---|---|---|---|
| Canopy air speed | 30 to 50 mm above the canopy top, front, middle and rear of the layer | 0.30 to 0.60 m/s, set from the crop recipe | Still air over part of a layer |
| Spread across the layer | Same probe grid, per layer | Coefficient of variation below the limit agreed in the recipe | A mean value that hides a dead zone |
| Air temperature | Canopy height, each layer | Crop recipe value, logged with the velocity | A room value that does not apply to the shelf |
| Relative humidity | Canopy height, each layer, day and night | Day target below the night target | Leaf wetness that favours disease |
| Vapour pressure deficit | Canopy height, with leaf temperature offset | 0.8 to 1.1 kPa in active growth, 0.4 to 0.8 kPa in propagation | Stalled transpiration or closed stomata |
The Measurement Point Decides the Answer
The same rack can pass or fail depending on where the probe was held and how many points were taken.
A supply-duct reading is a statement about the supply line. It can be in band, it can be repeatable, and it still says nothing about the air the plants receive, because the air that reaches the canopy has already passed a guard, a shelf edge, a light bar and the crop itself.
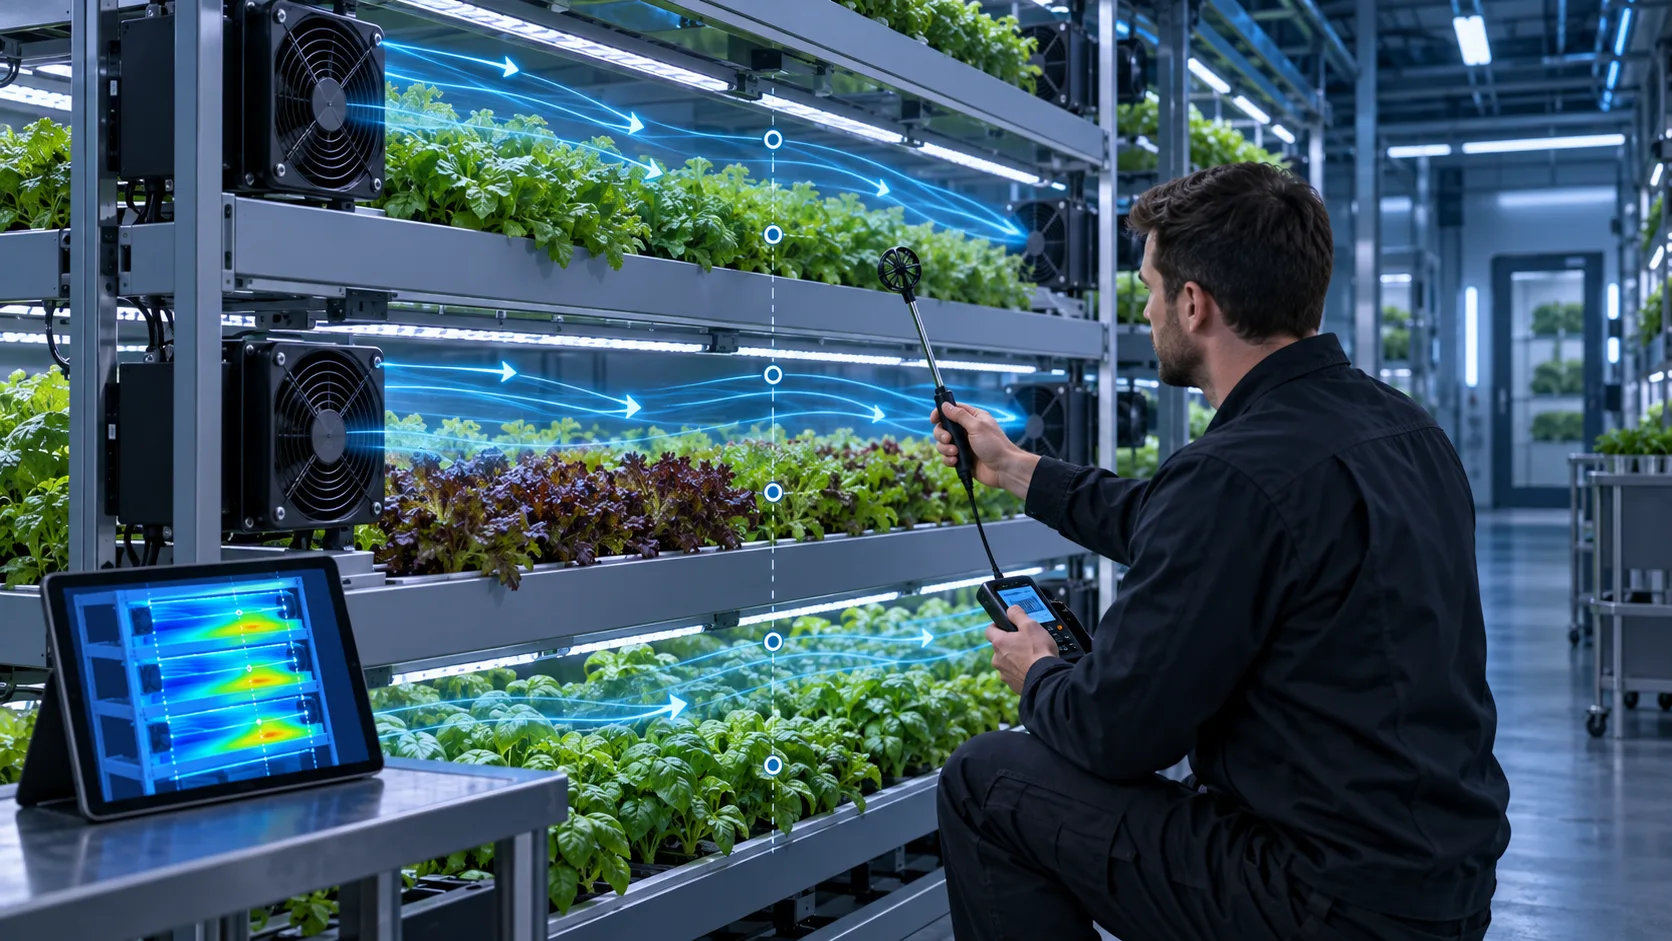
The figure below puts the two plans side by side on one populated rack module. Plan A takes a single reading at the duct, gets 1.4 m/s and accepts the layout; no canopy point is measured, so the dead zone at the rear of the middle layer is never seen. Plan B keeps the same hardware and runs a grid at canopy height on every layer, which returns nine readings and finds two outside the band, including one at 0.12 m/s. Same rack, same fans, different result, because the measurement point is part of the method.
The practical content of the method is short. Pick the probe height above the canopy top and keep it, cover the front, middle and rear of every representative layer, take the readings with the crop, lights and guards installed, and publish the probe positions with the result so the next farm can repeat it.

- One probe cannot show a spread
- The probe height above the canopy top is part of the result
- A duct reading covers the supply line and nothing else
- Publish the probe map so the measurement can be repeated
An Anonymised European Farm Project
The project team was not trying to win a catalogue CFM comparison. It needed repeatable air movement across a populated rack.
A European multi-level hydroponic farm project covered approximately 4,500 m2 and grew butterhead lettuce, sweet basil and microgreens. The project team reported an initial 14 percent crop-loss level associated with tip burn and powdery mildew. The loss figure was a project baseline, not a controlled claim that airflow alone caused every loss.
The team and MEGA Tech reviewed the rack dimensions, crop-zone target, available fan envelope and installation repeatability together. The selected platform was the 12 V DC MG8025H12X. Four fans were installed on each 2.5 m rack module so the upper, middle and lower crop zones were not dependent on a distant room-level discharge.
The catalogue row used for comparison lists approximately 44.3 CFM and 5.3 mmH2O at 3,500 RPM and rated voltage. The project note recorded approximately 42 CFM at the selected operating condition. Those values are kept separate on purpose: the catalogue row describes a defined test point on a test bench, while the project value belongs to the installed selection and its operating condition.
The reason the distinction matters is the canopy. Once the crop is in place, the rack presents a different resistance than an empty shelf, and the flow redistributes between the layer path and the path around it. A selection made on free-air CFM is a starting estimate; the number that decides the case is the one taken at the canopy with the crop installed.
- Application: multi-level hydroponic farm
- Reported facility area: approximately 4,500 m2
- Fan platform: MG8025H12X, 12 V DC
- Layout: four fans per 2.5 m rack module
- Project note: approximately 42 CFM at the selected operating condition
The Validation Was Done at the Crop Zone
The sample was judged by the air the plants received, not by the fan nameplate alone.
After the rack-level layout was installed, the project team reported 0.6 to 0.9 m/s across the measured crop zones. That range is specific to the project and should be read together with sensor location, crop stage, canopy density, fan command and HVAC state.
A practical validation map should cover upper, middle and lower shelves, the front and rear of the canopy, and the areas nearest the fan discharge and return. Repeat the map during day and night operation, at representative crop stages and with the populated rack installed. An empty shelf can hide the pressure drop and flow redistribution created by the crop, which is why a layout that passes on an empty rack can fail in the first week of a real crop.
Log temperature, relative humidity and vapour pressure deficit at the same time. On the fan side, record voltage, speed, current, noise and control response. This makes it possible to tell whether a later hot or humid zone is caused by fan performance, air-path obstruction, control logic, dehumidification or crop density.
The map is also diagnostic when the pattern is matched to a cause. A fast band only near the discharge with a slow rear means the supply is not reaching the canopy, so the layer needs a longer path or a diffuser rather than a bigger fan. Lower layers slower than the top points to stratification and a single high inlet, which baffles or per-layer supply can correct. One small pocket below the band usually means a bypass path or a blocked return behind the rack, so check the rear clearance before changing the fan. A whole layer above the band should send you to the control command and the tach reading first, because the recorded speed may not match the command.
- Map velocity at several points on every representative layer
- Log temperature, relative humidity and fan operating data with every measurement
- Repeat the comparison at different crop stages and day and night states
- Check the fan at the installed resistance rather than free-air conditions
- Leave access for cleaning, inspection and fan replacement
Instrument and Method: Getting a Number You Can Defend
The instrument, its calibration and the probe orientation are part of the measurement uncertainty.
A hot-wire anemometer is the usual instrument for canopy air speeds, because the useful low-velocity range is roughly 0.1 to 5 m/s, and that is where a vane anemometer starts to struggle. The common unidirectional probe must be aligned with the flow, so the reading depends on how the probe is held, and a probe waved through the canopy produces numbers that cannot be compared with the next visit.
The heated wire is sensitive to dust, moisture and changes in ambient temperature, so the instrument needs a calibration and cleaning schedule. Keep the calibration date and the ambient temperature in the record next to the readings, otherwise two sets of numbers taken months apart look comparable when they are not.
Sensor placement for the climate half of the map follows the same logic. A second temperature and humidity sensor should sit at the lowest-circulation point at canopy height, which is frequently the middle of the rack, rather than next to the supply where the air is best. Control should act on every sensor staying inside the band instead of on an average, because an average can be satisfied by two extremes and still leave a wet corner.
Log velocity, temperature, relative humidity, vapour pressure deficit, light state, fan command and fan speed together with a timestamp. A velocity number without the fan command cannot be reproduced, and a fan command without the tach reading cannot show that the fan delivered what it was asked for.
- Fix the probe height above the canopy top and keep it for every visit
- Align a unidirectional probe with the flow direction at each point
- Record the calibration date, ambient temperature and instrument used
- Log climate and fan data on the same clock as the velocity readings
Project-Reported Outcome and What It Does Not Prove
The result is valuable because the project connected the fan change to measured crop-zone conditions, but the numbers remain site-specific.
The project reported crop loss falling from 14 percent to 2.1 percent, a reported reduction of approximately 85 percent. It also reported a 1.5 day shorter growth cycle and a 12 percent net energy reduction, with fan power recorded as 1.8 W per unit in the project data.
Those results should not be turned into a universal fan claim. Crop variety, lighting schedule, nutrient recipe, HVAC duty, dehumidification, sanitation, plant density and measurement period can all change the outcome. The correct engineering use of the data is to define a baseline, reproduce the measurement method and verify the result under the new farm's own conditions.
The transferable lesson is the workflow: distribute air at the rack, measure at the canopy, compare catalogue and installed operating points honestly, then freeze the approved fan layout and inspection method for production.
Fan-Side Evidence to Record With the Map
The fan record should carry the operating point and the interface, not just the part number.
A catalogue row describes a defined test point. The installed fan sits behind a guard, a filter and a canopy, so the map needs the fan state that produced it: voltage, speed, current, control command, noise and the resistance it was working against. Without that, a later change in crop density or filter loading looks like a fan fault.
On a four-wire fan the interface is part of the evidence. The control input runs in the 21 to 28 kHz band with 25 kHz as the nominal value, the tachometer returns two pulses per revolution, and an open control input is normally full speed, which is the safe state for a cooling fan. Record the command as a duty cycle rather than as a percentage of an unknown scale, and record the tach reading at the same time so the delivered speed can be separated from the requested speed.
Environment moves the operating point as well. Density falls with altitude, and at 3,000 m the International Standard Atmosphere puts air density near 74 percent of sea level, so a fan that held the band in a coastal pilot may not hold it on a high-altitude site. Temperature and filter loading move the operating point along the fan P-Q curve in the same way and should be recorded as the conditions of the test, not as adjustments applied afterwards.
Life and noise belong in the same record. A bearing life statement is only meaningful with the temperature, the duty cycle and the speed it assumes, and a noise figure is only comparable at the same distance, speed and mounting.
- Record voltage, speed, current, control command and noise with every probe set
- Record the tach reading so delivered speed can be separated from commanded speed
- Note the resistance the fan was working against, including filter state
- Keep altitude and temperature as test conditions in the release record
Engineer FAQ: Crop-Zone Airflow Validation
The useful result is a repeatable crop-zone condition measured in the populated rack, not a free-air fan number.
Q: Is there one correct air-velocity target for every vertical farm? A: No. Published studies provide useful reference ranges, but the acceptance band depends on crop, cultivar, growth stage, canopy density, light load, humidity control, shelf geometry and measurement height. Set the final limit from the farm's own crop recipe and validation data.
Q: Why measure air velocity at the canopy instead of at the fan outlet? A: The fan outlet value does not show whether air reaches the leaves after passing shelves, lights, guards and the crop canopy. Canopy-level points reveal bypass, recirculation, low-velocity pockets and shelf-to-shelf differences.
Q: Why log vapour pressure deficit or humidity with velocity? A: Air movement affects heat and moisture transport, while vapour pressure deficit also changes with temperature. The same relative humidity at two different shelf temperatures does not represent the same crop environment, so velocity and climate data should be reviewed together.
Q: How many probes are enough? A: Enough to cover the front, middle and rear of every representative layer at the same height above the canopy top. Three points per layer is a workable minimum for a three-level rack when the layers differ in inlet condition or crop density; add points where the map shows a suspect pocket.
Q: How do I connect the fan to the rack result? A: Record fan voltage, speed, current, control command and noise while measuring the populated rack. Compare the result with the fan P-Q curve at the installed resistance, because free-air CFM cannot prove the crop-zone flow.
Q: Our probes read in band but tip burn continues. What next? A: Check the probe position against the leaf microclimate, then check the vapour pressure deficit and night humidity, and confirm that the band was set from the same crop stage that is failing. Air speed is one input to tip burn and not the only one.
Q: What should a small development sample prove? A: It should reproduce the representative shelf, lights, crop obstruction, guards and control states, then show whether the selected fan position and speed range meet the spatial airflow and climate limits before the layout is released for volume production.
- Tie every numerical answer to voltage, speed, temperature, mounting and test condition
- Separate catalogue maximums, engineering estimates and measured application results
- Use the FAQ to define the next measurement or sample-validation step
Questions for a Design Review
Ten questions that decide whether the crop-zone claim survives a review meeting.
Bring these to the review with the data behind each answer. A layout that cannot answer them is still a proposal, whatever the fan data sheet says.
- What is the acceptance band, and which crop, cultivar and growth stage set it?
- How many probes were taken, at what height above the canopy top, and on which layers?
- What is the coefficient of variation across each layer, and what limit applies to it?
- Was the map repeated with the populated rack, at night, and at a later crop stage?
- Where is the lowest-circulation point at canopy height, and which sensor sits there?
- Which fan command, voltage, speed and current were recorded with each probe set?
- What is the rear clearance, and how is the return path kept clear of the canopy?
- Which layer is the worst case at the end of the light period, and what is its measured air speed?
- If one layer fails the band, what is the corrective action, and who signs it off?
- What goes into the release record: fan variant, spacing, connector, control range, measurement points and limits?
From a Crop-Zone Problem to a Production-Ready Fan
A small sample can settle the airflow question before a farm commits to a full rack rollout.
For a new vertical-farm module, MEGA Tech can review the shelf dimensions, crop-zone target, LED heat, humidity conditions, available fan space, voltage, noise limit and control requirements together. The first build can be evaluated in a populated rack rather than selected from a free-air catalogue value alone.
That sample is also where the measurement plan is tested. If the probe grid, the logging method and the acceptance band are agreed at sample stage, the same map can be run again on the production rack and compared, instead of restarting the argument at commissioning.
What we need from you to start: the canopy air-speed and climate target with the crop and stage that produced them, the rack and shelf dimensions including the return path, the available fan envelope, the supply voltage and control interface, the noise limit at the operating state that matters, and the crop stage at which you intend to validate.
- Define the crop-zone velocity, spread and climate target
- Share the rack, shelf, light and return-path dimensions
- Build and test a sample in the populated rack module
- Freeze the approved fan layout and production inspection method