The Farm Can Be at the Right Average and Still Grow Unevenly
A room sensor can report an acceptable temperature while different shelves experience different air movement, humidity and heat removal.
Vertical farms stack a controlled climate into multiple layers. That increases production density, but it also creates a harder airflow problem: lights add heat, plants add moisture, shelves and canopies obstruct the path, and the upper and lower levels do not see the same resistance. A single room-average temperature is therefore not enough to prove that every crop zone is healthy.
The engineering question is not simply how much air the room fan can move. It is whether the installed system delivers a repeatable air velocity and temperature-humidity condition at the crop canopy, across the representative shelves and operating states that matter to the crop recipe.
Published cultivation guidance makes the same point from the grower's side: among all the climate factors in a vertical farm, an even airflow is the most difficult to achieve, because temperature, humidity and transpiration have to be levelled at the same time (Wageningen University and Research, Guidelines for cultivation in a vertical farm).
This distinction is important for leafy greens. Poor or uneven canopy air movement can limit transpiration and create local warm or humid zones. The University of Arizona describes airflow distribution, temperature, humidity and CO2 as linked variables in vertical-farm research, rather than isolated setpoints.
- Room-average temperature can hide shelf-to-shelf microclimates
- LED heat, plant transpiration, shelf geometry and crop density all change the air path
- The fan requirement belongs to the rack or growing layer, not only to the room HVAC system
- Measure the crop zone where the plant experiences the air
What the Published Data Actually Shows
Research supports targeted circulation, but its numbers belong to the test setup that produced them.
A 2014 study of a closed, multi-level plant-factory testbed compared cooling and heating alone with hybrid control that also used circulation fans. The study reported a maximum 78.9% reduction in the temperature difference between the top and bottom of the testbed and a maximum 63.4% improvement in air distribution. Those are useful engineering results, but they are not universal savings or performance guarantees for a commercial farm.
The same study used a defined test volume, four circulation fans, three measurement heights and a three-dimensional anemometer. That measurement discipline is the transferable part: define the layers, measure the air field and compare the installed control strategies under the same conditions.
Other vertical-farm studies reach the same practical conclusion from different geometries. A shipping-container CFD study found that inlet and outlet placement strongly changed canopy-level uniformity, while a lettuce growth-chamber study reported a useful canopy-air-velocity range of 0.3-0.5 m/s for its own experimental conditions and warned that higher air speeds could depress growth. Treat these values as research references, not a universal setpoint for every crop or rack.
Uniformity Needs a Metric, Not an Adjective
An even airflow has to be expressed as a number, or two layouts cannot be compared.
The standard way to describe evenness is the coefficient of variation: the standard deviation of the measured canopy air speed divided by its mean. A layout with a high mean speed and a high coefficient of variation can look impressive on an airflow chart while the lower shelf stays slow, so the mean alone never closes the question.
Published CFD work on a shipping-container vertical farm shows how much the number can move. With air inlets placed along the layer length, the canopy reached a mean air velocity of 0.65 m/s with a coefficient of variation of 33 percent - a usable average with a wide spread. Adding return outlets instead of a single exhaust dropped the coefficient of variation to 10 percent, which is the change that matters for crop uniformity (Sohn et al., Computers and Electronics in Agriculture, 2023).
The same metric logic applies to stagnant zones. A CFD model of a cultivation shelf with realistic plant structures reported that raising the inflow velocity cut the share of the canopy volume that counts as stagnant from 62.4 percent to 7.2 percent, while a staggered canopy layout produced a smaller improvement, from 16.4 percent to 13.2 percent (Gu and Goto, Agriculture, 2024).
Practical rule for a project: define the metric, the grid and the operating state before the first measurement, then report the metric with the layout that produced it. A review can compare a coefficient of variation with another coefficient of variation; it cannot compare two adjectives.
| Metric | What it answers | How to report it |
|---|---|---|
| Coefficient of variation (CV) | How wide is the spread relative to the mean? | Standard deviation divided by mean canopy air speed, per layer and per operating state |
| Relative standard deviation (RSD) | Same idea, used in plant-factory climate studies | Reported for air speed, air temperature and vapour pressure deficit above the canopy |
| Share of probes in range | How much of the canopy sits inside the target band? | Count of measurement points inside the target band divided by all points |
| Stagnant share | How much of the canopy sees almost no air movement? | Fraction of probes below the stagnation threshold agreed for the crop |
Fan Placement Is an Air-Path Decision
The fan location determines whether air crosses the canopy, short-circuits around it or creates a high-speed jet in one layer.
A common first approach is to place circulation fans wherever there is an empty mounting hole. That makes installation easy but does not prove that the airflow reaches the crop. Fans mounted too close to an obstruction can recirculate against the shelf, while fans pointed directly at a nearby opening can send air around the growing layer instead of through it.
Start with the rack module. Map the supply and return paths, the LED heat sources, the shelf depth, the crop canopy and the areas where air can bypass the plants. Then decide whether the fan should push along the layer, pull through the layer, or work with the central HVAC flow. The correct arrangement is the one that reduces stagnant zones without creating an excessive local velocity or unacceptable noise.
The product selection follows the path. A free-air CFM value is only a starting point. Grilles, guards, filters, narrow shelf gaps and crop resistance move the operating point along the fan's pressure-flow curve. If the installation is pressure-loaded, compare the fan's static-pressure curve at the required voltage and speed, then validate the complete rack rather than relying on a catalogue maximum.

- Draw the air path through the populated rack before choosing fan positions
- Avoid discharge paths that immediately bypass the crop layer
- Check inlet clearance, outlet clearance, grille area and shelf obstruction
- Choose the fan from the installed operating point, not free-air CFM alone
- Leave access for cleaning, inspection and replacement
Baffles and the Return Path Do the Heavy Work
In a narrow interlayer space, separating the layers is often more effective than adding another fan.
Stacked trays sit only a short distance apart, so the air space above one canopy is the air space below the next shelf. Thermal buoyancy pushes warm, moist air upward through that shared space, and a fan that adds velocity does not automatically fix the vertical imbalance.
A validated CFD study of a compact vertical farm with lateral air supply tested this directly. Airflow patterns stabilised once the Reynolds number of the supply air exceeded 3,574 with an Archimedes number below 0.1, and increasing the airflow rate beyond that point changed the distribution very little. At a low supply rate of 15 cubic metres per growing area per hour, buoyancy could still prevent cool air from reaching the crop. Inserting seven baffles to separate each layer changed the outcome: uniformity improved, and heat and moisture removal efficiency rose by 38 and 63 percent respectively (Kang and van Hooff, Thermal Science and Engineering Progress, 2025).
The engineering reading is that layout geometry sets the ceiling on what fan speed can achieve. Baffles, plenum depth, the return path on the far side of the rack and the position of the exhaust all decide whether the air crosses the canopy or drifts over it. Raise those before raising the fan speed.
The return path deserves as much attention as the supply. A layer that is fed but not relieved builds pressure and pushes air out through the nearest gap, which is rarely the one the designer intended.
- Separate the growing layers before increasing airflow
- Keep the supply and return on opposite sides of the rack module
- Give the return path a defined area instead of leaving gaps as the outlet
- Check that the baffle position does not block cleaning access
Measure Airflow Together With Temperature, RH and VPD
A fan can improve velocity while the crop still experiences the wrong moisture condition. The test must capture both air movement and climate uniformity.
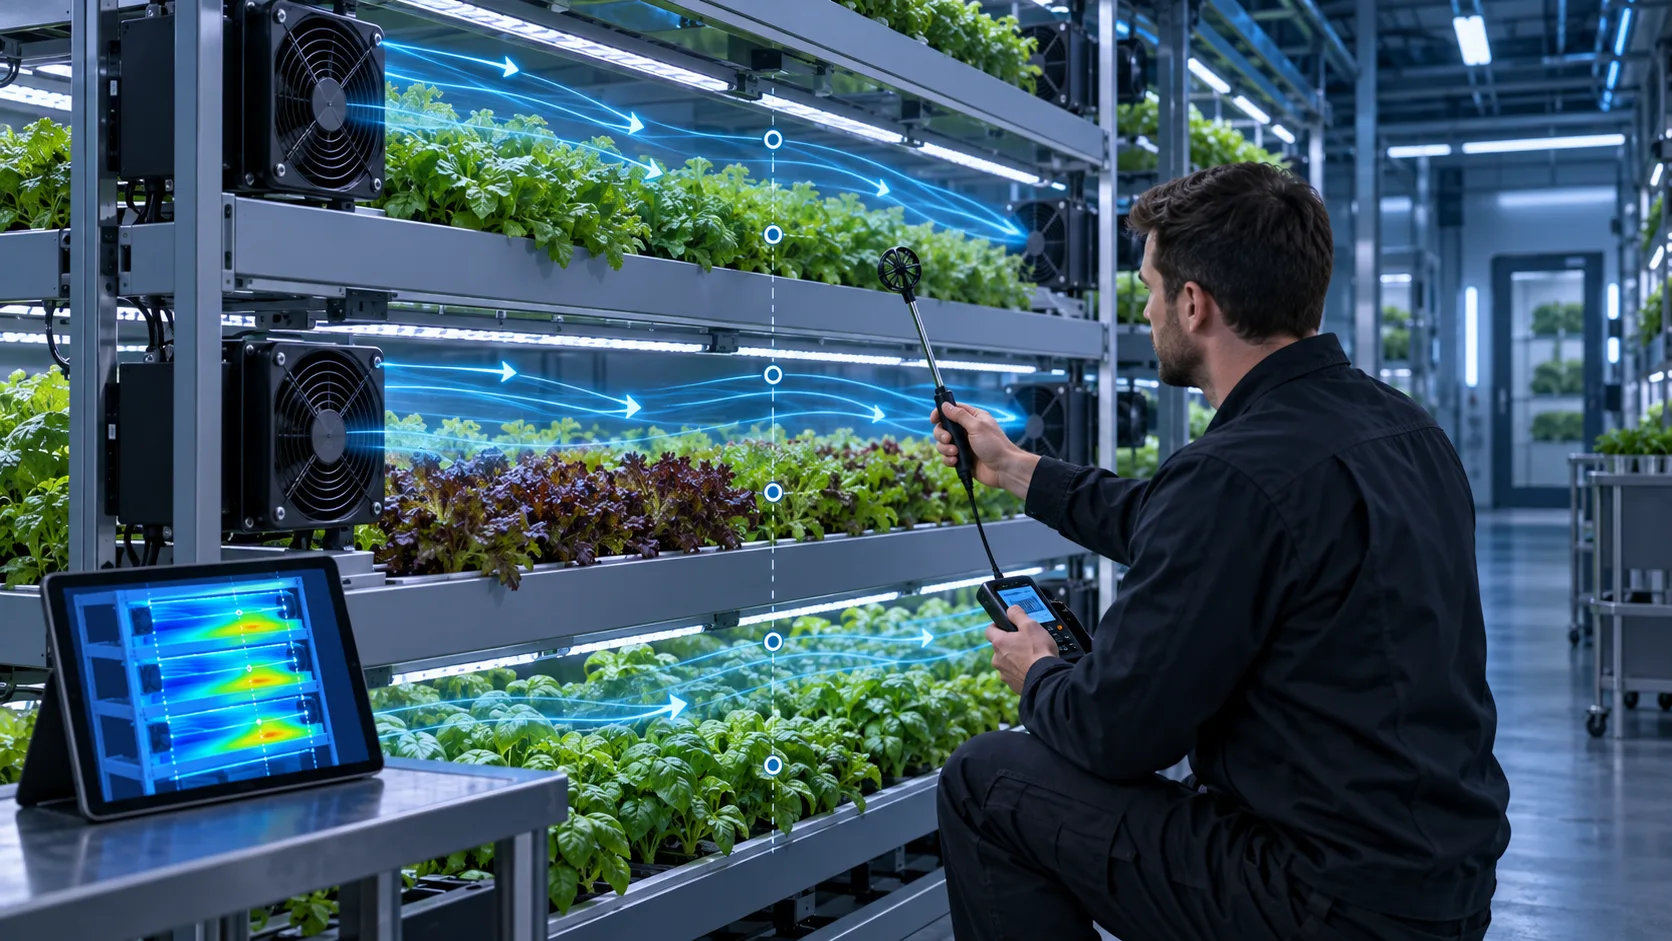
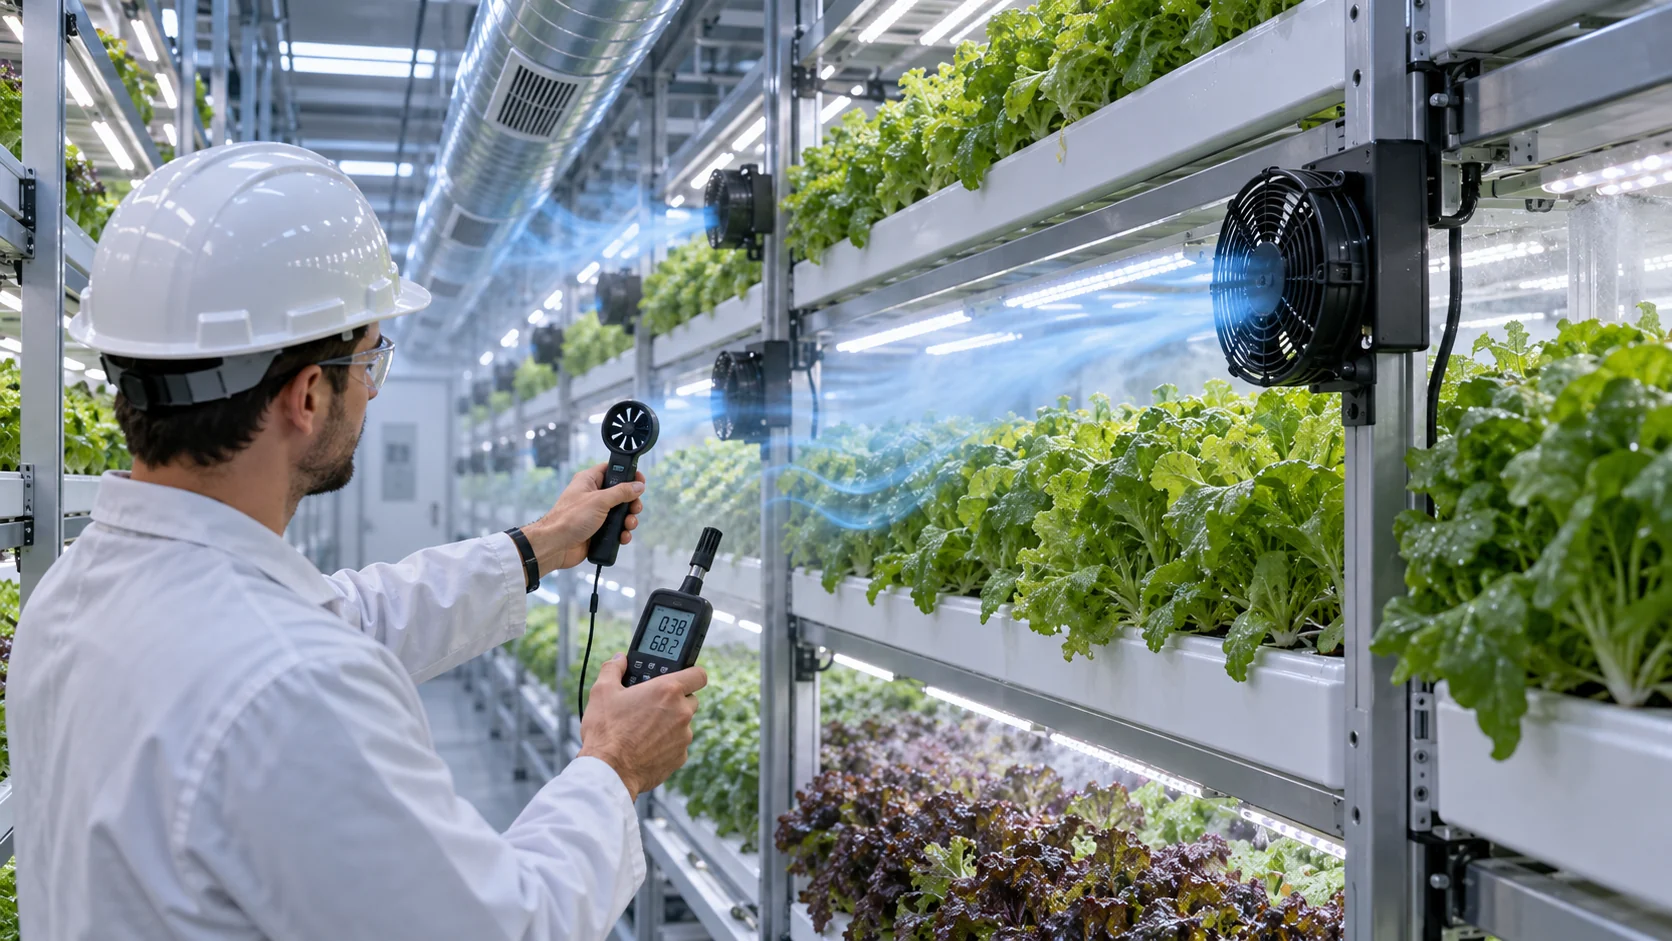
For a development sample, instrument representative upper, middle and lower shelves. Measure air velocity at the canopy height, temperature and relative humidity at the same locations, and record the fan voltage, speed, current and control signal. If the farm uses CO2 enrichment, variable lighting or dehumidification, include the operating states that change the heat and moisture load.
Vapor pressure deficit is useful because relative humidity alone can hide the effect of temperature. A warmer shelf at the same relative humidity does not have the same moisture-driving condition as a cooler shelf. That is why plant-factory climate studies report uniformity for air speed, air temperature and vapor pressure deficit together rather than for one variable at a time, and why cultivation guidance treats VPD as the driving force for transpiration.
Do not measure only an empty shelf. Repeat the test with representative crop density, guards, filters and lighting installed. Record the sensor positions and the averaging period so that a later crop recipe or fan-speed change can be compared with the same baseline.
Instrumentation choice matters as much as sensor count. A hot-wire probe gives a fast local reading but is easily disturbed by a hand or a light fixture, so mount it on a stand. Map the probe grid on a drawing of the rack, and keep the same grid at every test state - a uniformity number is only comparable to another uniformity number measured on the same grid.
Air Velocity Targets and Crop Limits
A canopy speed target is a crop decision first and a fan decision second.
Air movement at the leaf surface controls the boundary layer, and the boundary layer controls heat, water vapour and CO2 exchange. As the horizontal air current speed rises from 0.01 to 0.8 m/s, published plant-physiology work on a dwarf-rice canopy reports evaporation and net photosynthetic rates rising by about 2.5 and 2 times respectively, which is why air movement is treated as a growth variable and not only as a cooling variable.
Practical ranges in the literature cluster tighter than that experimental sweep. A lettuce growth-chamber study reported 0.3-0.5 m/s as useful under its own conditions and cautioned that higher speeds can depress growth; cultivation guidance for vertical farms puts the controllable canopy air speed at 0.2 to 1 metre per second using inverter-driven fans, adjusted for growth stage, planting density and morphology (WUR). Plant-factory CFD work lists 0.1-1.3 m/s as the band that promotes photosynthesis and transpiration while still reducing stagnant zones.
The engineering consequence is that the target band has a floor and a ceiling. Too little movement leaves humid, warm microclimates and raises the risk of tip burn and weak transpiration; too much dries the canopy, raises noise and spends fan power without adding growth. Write both limits into the acceptance criteria, and state the height at which the velocity is defined.
Crop response also changes with variety and stage. A canopy that is acceptable at transplant density can lose its air path once leaves close over the tray, so the velocity check belongs to more than one point in the growth cycle.
- State the target band with a floor and a ceiling, not a single value
- Define the measurement height relative to the canopy
- Re-check the band at the densest canopy in the growth cycle
- Treat tip burn, humidity pockets and noise as symptoms to investigate
Control Strategy and Fan Energy
Air movement has to be delivered without turning the farm into a fan hall.
Vertical farms are usually built airtight, which changes the meaning of ventilation. Cultivation guidance reports an air exchange rate of roughly 0.01 to 0.02 per hour for a well-sealed vertical farm, and notes that a minimum exchange is still kept to prevent ethylene from accumulating. Internal circulation, not outdoor air, is what creates canopy movement, so the circulation design carries the climate control and the energy bill at the same time.
Control strategy should follow the crop recipe: light period versus dark period, dehumidification cycles, CO2 enrichment windows and the growth stage. Inverter-driven or EC fans make that possible at the canopy, because speed is continuously adjustable and the fan can be slowed rather than switched off when the load drops. For each state, record the commanded speed, the measured canopy speed at the reference grid and the fan power, so a later optimisation can be judged against evidence rather than an estimate.
Energy-efficient layouts exist, and they are found with the metric approach above. A CFD evaluation of container and building vertical farms compared ten supply and circulation configurations: direct air-conditioner discharge gave a better uniformity index than ducted supply, upper layers benefited most from rack fans, and a sidewall fan arrangement cut fan energy use by 55 percent while giving up about 8 percent of uniformity (Biosystems Engineering, 2026). The trade is explicit, which is exactly what a design review needs.
Practical starting points: choose EC fans for the controllable speed range, verify stable operation at the lowest commanded speed used in the recipe, keep the fan out of the acoustic band that annoys staff, and prefer a layout change over a speed increase when the metric says the lower layer is still slow.
- Tune circulation to the crop recipe, not to a constant full speed
- Record fan power together with the canopy metric for each operating state
- Confirm stable, restartable operation at the minimum commanded speed
- Compare a layout change and a speed increase on the same metric before choosing
Engineer FAQ: Airflow Uniformity in Vertical Farms
A vertical-farm fan is selected for the crop-zone condition it creates, not only for the room airflow it moves.
Q: Why is total CFM not enough for a vertical farm? A: Total flow can coexist with dead zones, short-circuiting and shelf-to-shelf differences. Measure air speed, temperature, RH and, where relevant, VPD at representative crop-zone locations.
Q: What causes uneven airflow across stacked shelves? A: Fan placement, plenum geometry, obstructions, pressure imbalance, leakage and outlet layout can all create non-uniformity. Treat the rack and fan arrangement as one air-distribution system.
Q: Should the fan run at full speed continuously? A: Not necessarily. Control strategy should follow the crop recipe, heat load, humidity-removal capacity, noise limit and energy target. The fan must remain stable and controllable across the intended operating window.
Q: How can a small sample prove the layout? A: Instrument a representative rack or crop zone, use the intended shelves and obstructions, and compare velocity and climate maps at the key operating states. A sample should answer whether the arrangement is repeatable before a full rollout.
Q: What should be checked before production? A: Confirm airflow uniformity, temperature, RH or VPD, fan power, noise, filter condition, maintenance access and restart behavior. Keep the tested fan position, speed range and acceptance points in the production baseline.
Q: How should we report the uniformity result? A: As a metric with its grid and operating state - for example the coefficient of variation of canopy air speed per layer, the share of probes inside the target band, and the stagnant share - so the next layout can be compared on the same basis.
- Tie every numerical answer to voltage, speed, temperature, mounting and test condition.
- Separate catalogue maximums, engineering estimates and measured application results.
- Use the FAQ to define the next measurement or sample-validation step.
From One Rack Module to a Repeatable Design
Test one populated module, correct the air path, then freeze the fan and installation details before scaling.
A full-farm airflow study is expensive to repeat. A single populated rack module is not: it can be instrumented, changed and re-measured in days, and it carries the same shelf spacing, canopy density and baffle geometry that the rest of the farm will use.
Compare the two layouts honestly. Run the scattered-fan configuration and the per-layer configuration on the same module, at the same total airflow if possible, and report the metric for each. If the lower layer improves while the top layer loses a fast jet it never needed, that is a good outcome - the goal is the target band, not the highest number in the rack.
Once the layout meets the acceptance limits, freeze the production configuration: fan model or custom variant, mounting position and orientation, baffle and plenum dimensions, connector, cable length, control range, inspection points and replacement access. That turns a one-off prototype into a repeatable airflow module for future racks.
- Start with one populated rack module, not a free-air test stand
- Separate fan selection problems from air-distribution problems
- Validate day/night, crop-density and HVAC/dehumidification operating states
- Freeze the approved fan, layout, control range and inspection method before scale-up
Questions for a Design Review
Bring these questions to the review that approves the airflow layout for the next rack.
Each question below can be answered with a document or a measurement. If one of them can only be answered with an opinion, the review is not finished.
- Which metric defines the uniformity acceptance limit, and on which measurement grid was it taken?
- What canopy air speed band was agreed, at which height, and for which growth stage?
- Where does each layer get its supply air, and where does that air leave the rack?
- Which baffles, plenums or return paths were changed after the first measurement, and what did the metric do?
- What fan power, noise level and minimum stable speed were recorded for each operating state?
- If the crop density increases, which measurement proves the layout still holds?
How MEGA Tech Supports Vertical-Farm Airflow Projects
The fan is one part of the answer. The sample is selected for the installed operating point and validated on the customer's rack.
MEGA Tech builds custom DC and EC fans for interlayer circulation: compact axial units for through-layer movement and backward-curved centrifugal blowers where a pressure-loaded plenum or a narrow duct has to be fed. Selection is made against the installed operating point - canopy air speed target with the shelf, canopy and baffle resistance in place - not against a catalogue maximum, and samples are validated on the customer's rack before the design is frozen.
To specify a fan for a rack, we need the rack dimensions and shelf spacing, the number of growing layers, the canopy air speed target with its measurement height, the available fan space and mounting pattern, the supply voltage and control interface, the noise limit, the cleaning and humidity environment, and the sample quantity planned for the first build.
The clear boundary: MEGA Tech supplies the fans and the airflow module around them. We do not design the room HVAC system, the irrigation or nutrient delivery, the lighting control, the crop recipe or the structural design of the rack, and we do not guarantee a yield outcome - that belongs to the grower's crop trials. What we do commit to is a fan and layout that hold their measured canopy condition and can be repeated in the next rack.
If your project is at the first rack or pilot stage, send the rack drawing, the canopy target and the airflow problem you are seeing. We can help turn that into a fan sample and a measurement plan before the layout is repeated across the farm.
- Custom compact axial and backward-curved centrifugal fans for interlayer airflow
- Selection by installed operating point and canopy target, not by size alone
- Samples validated in the customer's rack module before the design freeze
- Frozen configuration with inspection points for repeat racks