The Datasheet Number Is Measured in an Empty Room
Many fan datasheets lead with a free-air CFM figure measured at zero back-pressure. An AI server is never at zero back-pressure, which makes that number a ceiling rather than a complete specification.
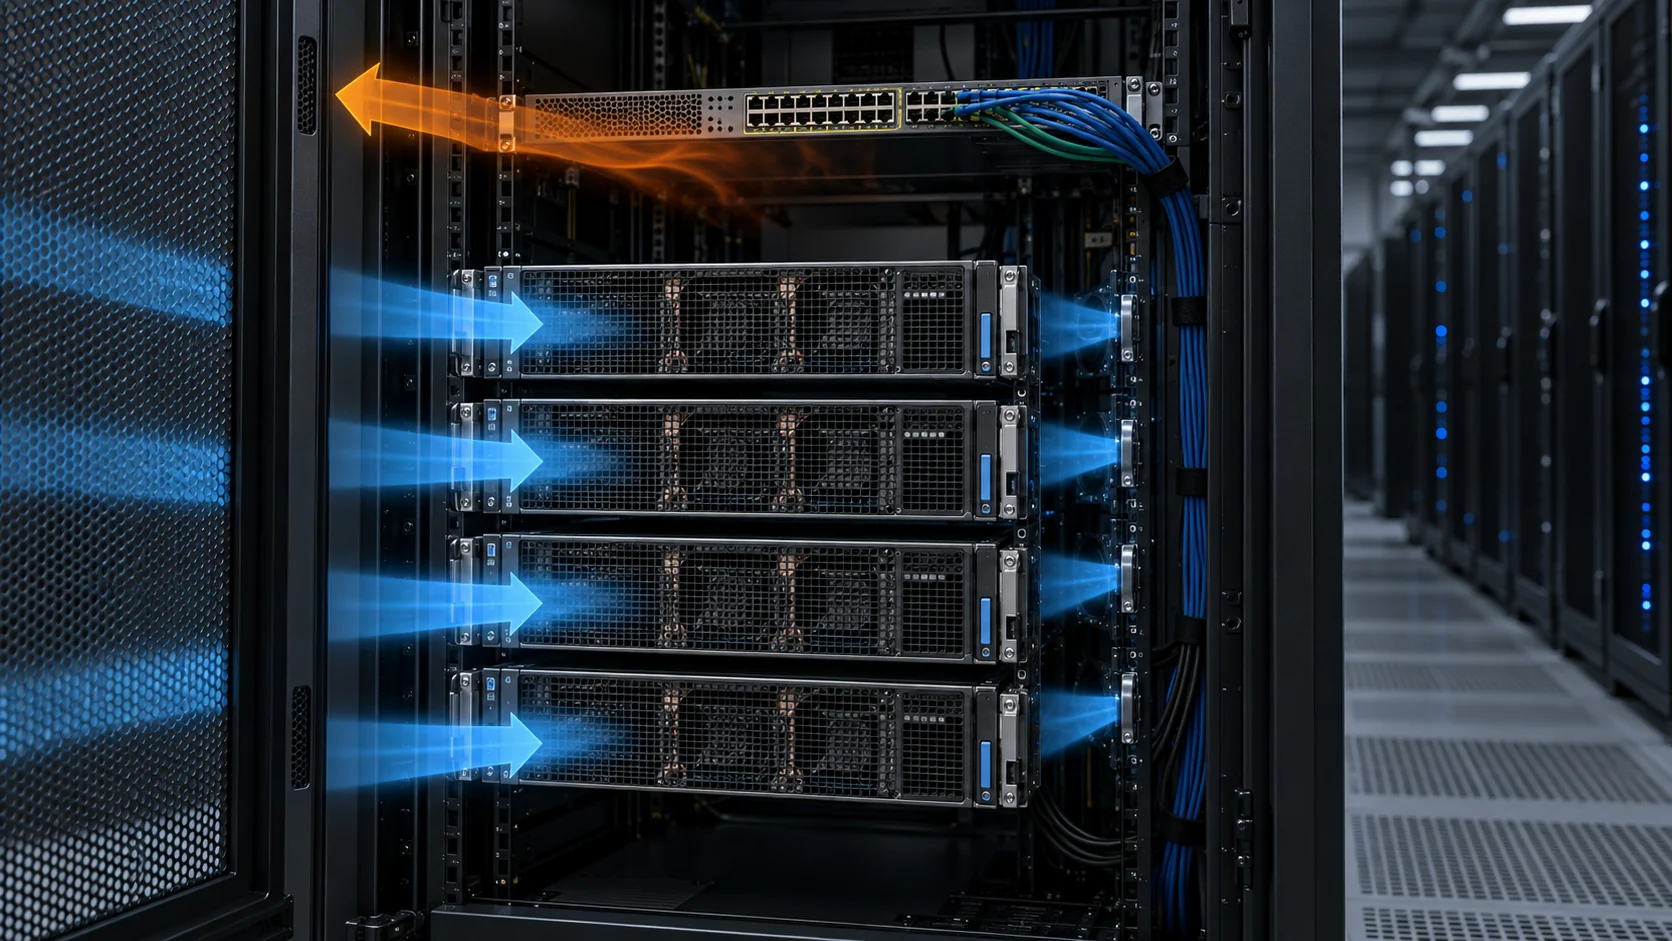
Free-air CFM is measured on a flow bench with nothing downstream of the fan: no grille, no filter, no heat sink, no backplane. It is the airflow a fan produces when the air has nowhere to go but out. The moment you bolt that fan into a GPU node, the air has to get through a perforated bezel, a dust and EMI mesh, a drive cage, a row of accelerator cards, a bank of finned heat sinks, DIMM channels, power supplies, a backplane and its cabling, and finally a restricted rear exhaust. Each one takes a cut of the fan's pressure budget. What actually leaves the chassis is whatever survives all of them.
The two numbers that describe a fan are the endpoints of its P-Q curve: airflow at zero back-pressure, and pressure at zero airflow. Neither is an operating condition. The fan runs somewhere on the curve between them, at the point where that curve crosses the resistance curve of your chassis. Selecting on either endpoint alone is selecting on data the fan will never see. Before comparing curves, confirm the test method, air density, voltage, speed command and whether the pressure is total or static; otherwise two apparently similar curves may not be comparable.
This is also why the installation condition belongs in the requirement. AMCA describes system effect as the loss caused by non-uniform flow, inlet or outlet obstructions, transitions and nearby accessories. A fan can meet its laboratory curve and still miss the installed duty when the chassis gives it a poor inlet or a restricted discharge. Treat the fan curve and the air-path design as one selection problem.
This is where spec sheets become actively misleading. Consider two illustrative 120 mm candidates: one with a stronger pressure curve and one with a higher free-air number but weaker pressure capability. Behind the same restrictive GPU chassis, the higher free-air fan can deliver less air at the operating point. The exact result must come from the two measured curves and the chassis resistance; the example is a method illustration, not a product comparison.
And the margin you win by selecting correctly is thinner than it looks. In this schematic example, loading the filter shifts the impedance curve and moves Fan A from 89 CFM to about 76 CFM. Those values are illustrative, not a universal filter penalty; the installed airflow must be measured or calculated from the actual filter curve. Selecting the right fan on a clean bench and selecting a fan that still works in month eighteen are different tasks, and only the second one uses the dirty-filter case. Correct selection is not the same as durable selection.

- Free-air CFM is measured at zero back-pressure — a ceiling, not a specification
- The operating point is the intersection of the fan curve and your system impedance curve
- A higher free-air rating can deliver less installed airflow
- Curve shape between the endpoints matters more than the endpoints themselves
Where the Pressure Actually Goes
System impedance is the sum of every restriction in the air path, and in a high-density GPU node that list is longer than most designers expect.
Walk the path from the front bezel to the rear exhaust and you accumulate resistance at every step. Perforated metal is often underestimated: the open-area ratio, hole shape, thickness and approach flow all affect pressure drop. A grille that looks open to the eye can still be a meaningful restriction, while a poor transition can add turbulence beyond the grille's own loss. Use the grille manufacturer's pressure-drop data or measure the assembled inlet.
Then come the elements that dominate. Dense heat sinks over the accelerators are usually the single largest term, because fin pitch sets both the surface area you need and the pressure you pay for it. Drive cages, DIMM banks and power supplies add their share. And the backplane plus its cable bundle is frequently worse than designers expect: cables are not aerodynamic, they are routed after the thermal design is frozen, and they sit directly in the exhaust path.
There is also a geometric penalty in very narrow board and heatsink passages. As hydraulic diameter shrinks and surface area relative to the flow area increases, pressure loss can rise sharply; the exact transition depends on the passage geometry and airflow regime. This is why a 1U node is often a different thermal problem from a 2U chassis carrying similar silicon.
One term on that list behaves differently from all the others: the filter. Every other restriction is fixed the moment the sheet metal is cut. The filter starts at its clean-state resistance and gets worse every month it is in service, steepening the impedance curve continuously. That is why the design case is the worst-case dirty filter rather than the out-of-the-box one — and why a fan that clears the requirement on day one can fall short eighteen months later.

- Impedance adds in series; the total is the sum of every restriction in the path
- Dense heat sinks are usually the largest single term
- Narrow board and heatsink passages can raise pressure loss sharply
- The filter is the only term that changes over time — design to the worst case
Sizing the Fan: From Watts to a Working-Point CFM
Two calculations, in this order. First how much air the heat actually needs, then whether the fan can deliver that much air against your resistance.
Start with the heat. The airflow needed to carry away a given power at a given temperature rise follows directly from the specific heat of air. At near-sea-level standard-air conditions it reduces to a useful first estimate: CFM ≈ watts ÷ (1.76 × ΔT), where ΔT is the allowable rise from air inlet to air exhaust. A node putting 900 W into the air with a 12 °C allowable rise needs about 43 CFM through the hot zone. Correct the estimate for altitude, air temperature, humidity and the portion of heat that is removed by another cooling path.
Those 43 CFM are not the fan's free-air rating and they are not a number on a box. They are the volume that has to actually pass through the constrained part of the chassis, at the operating point, with a loaded filter in place. As a separate system-level reference, NVIDIA's DGX SuperPOD design guidance gives a minimum of 157 ft³/min per kW for its stated conditions, while noting that the actual requirement changes with altitude, environmental conditions and component Delta T. That reference is useful for sanity checking a rack design, but it is not a substitute for the server's own heat map and impedance curve. Converting the result into a fan rating is the whole job.
The conversion is the intersection problem from the first section. Take the fan's P-Q curve, take your system impedance curve, solve for where they cross, and compare the answer with the CFM you need. The solver below does exactly that for a bank of identical fans in parallel, then re-runs it with one fan dead so you can see whether your redundancy is real or merely nominal.
Two things the arithmetic exposes quickly. The first is parallel interference: fans in parallel add airflow but not pressure, and they do not simply add — a bank of six rarely delivers six times what one fan delivers against the same resistance, because each fan is now working further out along its own curve. The second is how much of the speed range the operating point consumes. If the solver says the fans must run at 98% to hold temperature, you have no headroom left for a fan failure, a hot inlet day, or a filter that has loaded up.
- Size from the heat load first: CFM ≈ W ÷ (1.76 × ΔT)
- Then solve for the intersection with your own measured impedance curve
- Fans in parallel add airflow, not pressure — and not linearly
- Verify the N-1 case at full command before calling the bank redundant
48 V vs 12 V: What Actually Changes for the Fan
The move to 48 V distribution is driven by rack-level physics, not by the fan. But it changes what a fan of a given frame size can do.
The arithmetic behind the shift is straightforward. Delivering 100 kW to a rack at 12 V means handling roughly 8,300 A; at 48 V it is roughly 2,100 A. Resistive loss goes as the square of current, so the same power at a quarter of the current greatly reduces loss in cables, connectors and board traces. The Open Compute Project's Open Rack V3 specifications define a 48 V busbar architecture, but that rack-level voltage does not automatically determine the voltage of every equipment fan.
For the fan itself, the practical question is what the selected motor and electronics can deliver at the available rail. A higher-voltage fan platform may support more power within a connector and harness limit, but frame size, motor design, control electronics, noise, EMC and the actual P-Q curve still decide whether it suits a 1U or 2U chassis. Do not transfer a published 12 V or 48 V performance claim to another fan family without checking its own data.
The second-order benefits matter more than they sound. Lower current can mean lighter harnesses: a 240 W fan bank draws about 20 A at 12 V, about 10 A at 24 V and about 5 A at 48 V. Thinner cables can occupy less of the exhaust path, reducing one impedance term. Voltage drop improves with higher distribution voltage for the same power and conductor, but the actual result depends on harness length, resistance, connectors and fan current. A higher-voltage control platform still needs its own PWM, tachometer, EMC and protection validation.
It is not free, and it is not universal. A 48 V design brings additional connector, insulation, clearance, protection and compliance requirements compared with a 12 V design. If the platform is 12 V throughout, specifying one 48 V fan means adding a rail and a conversion or distribution path. It makes most sense when the platform already uses higher-voltage distribution, has many fans or long harnesses, and the measured fan benefit justifies the integration work.
One further wrinkle is worth flagging. At the densities AI clusters are now reaching — 100 kW and beyond per rack — even 48 V distribution starts to strain, and the industry is already evaluating higher-voltage DC backbones at rack or row level. Choosing 48 V fans is a sound decision for this generation of hardware. Assume the power architecture above them will keep moving.
- Same power at 48 V means a quarter of the current and about a sixteenth of the resistive loss
- A higher-voltage platform can simplify current and harness limits, but the fan curve still decides performance
- Lighter harnesses also reduce airflow blockage in the exhaust path
- Higher-voltage fan rails bring additional connector, insulation, protection and compliance work
N+1 Is Not Just "Add One More Fan"
Redundancy is a system behaviour, not a part count. A six-fan bank with one spare can behave like three different cooling systems depending on how you run it — and on what happens when one stops.
The first thing to get right is what parallel actually does. Under the usual idealized model, fans in parallel add airflow at a given pressure; they do not add pressure. Two identical fans behind a given resistance deliver more air than one, but the combined curve still tops out near the same maximum static pressure as a single unit. Real spacing, inlet interaction, discharge interaction and flow imbalance can make the result lower, which is why adding fans has sharply diminishing returns in a high-impedance chassis.
The second is the failure mode people forget. Depending on the fan construction and the surrounding path, a stopped fan can become a low-resistance reverse-flow path rather than a neutral hole in the wall. The working fans may push air through it in reverse, so a fraction of the cooling airflow circulates instead of crossing the heat. Mitigation is either mechanical — gravity louvres or back-draft dampers — or electronic and fast: rotor-lock detection feeding the BMC, which ramps the survivors before recirculation settles in.
The third is where the operating point sits in normal service. Leave verified speed and pressure headroom for the N-1 case, a hot inlet, a loaded filter and manufacturing variation. There is no universal 70% setting: the correct normal duty depends on the fan curve, system curve, thermal budget, acoustic target and required degraded state.
Open Compute server specifications show the level of discipline expected in a high-density platform: fan redundancy, defined inlet conditions, thermal margin, airflow-per-power targets and rack-level thermal testing are specified together. Those figures are platform-specific, not universal requirements for every AI server, but the structure is reusable for a design review.
Then there is the failure mode redundancy cannot fix. Fans in a bank are usually the same model, from the same batch, at the same speed, in the same hot air. They age together. N+1 protects you against one unit failing early; it does not protect you against the population reaching its wear-out point in the same month. Plan replacement against the L10 of the population, not on the assumption that the spare will still be fresh when you need it.

- Fans in parallel add airflow, not pressure
- A stalled fan is an open hole — air recirculates backwards through it
- Set normal duty from measured headroom, not from a universal percentage
- Same model, same batch, same air: N+1 does not protect against common-mode wear-out
Acoustics, and Why 1U Pays for Every Millimetre
Noise is not a separate problem from cooling. Both are consequences of the same variable, which is how fast the blades are turning.
Aerodynamic noise often rises steeply with fan speed. For geometrically similar fans under comparable conditions, fan-law estimates commonly use a fifth-power relationship for sound power, but this is an estimate rather than a universal acoustic law. The installed result also depends on blade geometry, grille, system pressure, motor commutation and the measurement method. Lowering speed can reduce noise and power, but the installed thermal margin must be checked at the same time. Running the last part of the speed range to close a temperature gap can be expensive in noise, power and bearing life.
Which is why the diameter argument keeps coming back. For geometrically similar fans, the affinity laws give Q proportional to speed, pressure proportional to speed squared, and power proportional to speed cubed. A speed change from 5,000 to 4,000 RPM therefore predicts about 80% of the airflow, 64% of the pressure and 51% of the power before system effects are considered. The real result still has to be read from the fan curve and system curve, because different frame sizes and blade geometries are not geometrically similar. The constraint is not preference, it is geometry: a 1U chassis is about 44 mm tall, which is why compact servers often need small fans at higher speed.
It is also why the 21-inch internal width of the OCP Open Rack V3 standard matters more than a two-inch dimension sounds like it should. That extra width is what allows larger-diameter fans side by side in the IT gear, which is what allows the same airflow at lower RPM, which is what makes high-density air cooling acoustically and energetically survivable. The rack standard and the fan selection are the same decision viewed from opposite ends.
Beyond speed, the cheap fixes are worth knowing. Vibration isolators stop the chassis acting as a speaker cabinet — sheet metal is an excellent amplifier. Grille geometry sets how much of the blade-pass tone you hear, and blade pass frequency is simply RPM ÷ 60 × blade count. It is worth calculating, because a tone landing in the sensitive part of the hearing range is far more objectionable than broadband noise at the same measured level. And remember that data centre noise exposure is regulated: the acoustic budget is a compliance item, not a comfort one.
- For similar fans, sound power is often estimated with a fifth-power speed relationship
- Measure noise and thermal margin together at normal and peak duty
- Larger fans can move the same air at lower speed when the chassis allows them
- Isolate vibration, and keep the blade-pass tone out of the ear's sensitive range
A Specification Checklist That Survives Contact With the Chassis
The goal is not to find the biggest fan. It is to arrive at a selection you can defend when the prototype runs hot — with the assumptions written down before the metal is cut.
Ask for the curve, not the headline. A full P-Q curve with the test standard and conditions stated, at the voltage you will actually run. If a supplier will only quote free-air CFM and maximum pressure, you have two points of a curve you need all of.
Characterise your own air path before you pick anything. CFD on the CAD model during design; a sealed mock-up on a flow bench once you have hardware. Either is far cheaper than discovering the impedance after the tooling is committed, and both give you the K in ΔP = K × Qⁿ that every downstream decision depends on.
Then test the cases that will actually hurt you. The operating point with a loaded filter, not a clean one. The N-1 case at 100% command, in the chassis, on a hot day. The worst mounting orientation, if the datasheet claims more than one. Fans that pass on the bench and fail in these three cases are the normal outcome, not an unlucky one.
Finally, instrument it. Tachometer feedback is the cheapest health sensor you have, and it turns the failure criteria from Article 06 into a monitoring list: trend the speed, watch for a fan that needs more duty to hold the same temperature, and replace on the trend rather than on the alarm. A fan bank that tells you it is ageing is worth more than a fan bank with a slightly longer published hour figure.
- Get the full P-Q curve with test conditions, at your operating voltage
- Measure your own impedance — CFD in design, flow bench on hardware
- Verify the dirty-filter case and the N-1 case, not the bench case
- Trend the tachometer; replace on the signal, not on the hour count
Engineer FAQ: AI Server Fan Selection at the Real Working Point
AI server cooling should be specified from heat load, chassis resistance and inlet conditions, then proven in a representative populated chassis.
Q: Why is maximum CFM not enough for an AI server? A: Maximum CFM is normally the free-delivery endpoint at nearly zero external resistance. The useful airflow is where the fan P-Q curve intersects the server, heatsink, filter and grille system curve. Ask for the full curve and its test conditions.
Q: How do I make a first airflow estimate from server power? A: Use Q = P / (rho x cp x Delta T) as a first estimate for the heat carried by air. For the simplified near-sea-level form used in this article, CFM is approximately watts / (1.76 x allowable Delta T in degrees C). State the heat-load boundary, air density and inlet-to-exhaust temperature rise, then validate the result in the actual air path.
Q: What should be included in an AI server system resistance curve? A: Include the bezel or grille, filter in its clean and maintenance-limit states, accelerator heatsinks, DIMM and drive obstructions, cabling, backplane, transitions and exhaust restrictions. Poor inlet or discharge geometry can also create system effects that are not represented by a free-air fan test.
Q: Do fans in parallel provide twice the airflow? A: Not automatically. Parallel fans add their flow at a common pressure in the idealized model, but the operating point moves along the combined curve. Spacing, inlet interaction, discharge interaction, flow imbalance and the chassis curve determine the installed result, so measure the bank rather than multiplying one-fan CFM.
Q: Does RPM or FG feedback prove that the server has enough cooling? A: No. A fan can hold commanded speed while a loaded filter, blocked heatsink or bypass path reduces useful airflow. Pair speed and fault signals with inlet temperature, component temperature, pressure or airflow, power and a defined degraded-state response.
Q: What should a customized AI-server fan sample prove before production? A: Use representative heatsinks, boards, cabling, grille, filter, firmware and mounting orientation. Check the normal, peak-load, hot-inlet, loaded-filter and N-1 cases, recording airflow, pressure, inlet and component temperatures, RPM, current, power, noise, PWM response and fault behavior.
- Tie every numerical answer to voltage, speed, temperature, mounting and test condition.
- Separate catalogue maximums, engineering estimates and measured application results.
- Use the FAQ to define the next measurement or sample-validation step.
From Checklist to Shortlist: MEGA Tech DC Fan Options
The method above is generic. The next step is where a fan manufacturer earns its place: turn your chassis limits into a production-representative sample, then refine the fan around the measured result.
MEGA Tech's published DC fan range records dimensions, rated voltage, current, power, speed, maximum airflow, maximum static pressure, noise and P-Q drawings for each variant. We use those records as the starting point, not the finish line: your available space, actual resistance, control strategy and target operating point determine which fan platform is suitable.
When a standard catalogue variant is not the right fit, our engineering team can work through the practical adjustments with you, including frame and thickness, speed range, voltage, connector and lead wire, PWM or tachometer requirements, bearing choice, airflow direction and other application details. For an early-stage product, that can start with a small sample build rather than forcing the project into a high-volume commitment.
The sample should be tested in the populated chassis at the real duty, not on a clean bench. We review the measured airflow, pressure, temperature, noise and control response with the product team, refine the design where needed, and then carry the approved specification into reliable volume production. That is how a lower-cost alternative becomes credible: it must solve the thermal problem and remain consistent from sample to batch.
- Start with the product envelope, thermal target and real airflow resistance
- Customize the fan around confirmed electrical, control, acoustic and mechanical requirements
- Validate a production-representative sample in the populated chassis
- Move the approved specification into consistent, cost-conscious volume production