Lower RPM Does Not Automatically Mean Lower Cooling Energy
A data-center fan can consume less electrical power at low speed and still create a worse system if rack airflow, pressure or thermal margin is not maintained.
AI data-center cooling discussions often jump from a good objective to an incomplete conclusion: reduce fan speed to improve PUE. The objective is valid, but the test must include the complete thermal chain. A server fan, rack fan wall, CRAH fan array and heat-rejection fan each see a different system curve. Reducing one command may move pressure, airflow, inlet temperature and workload throttling somewhere else.
ASHRAE's data-center guidance treats cooling performance, power consumption, acoustic signature, reliability and redundancy as connected design characteristics. It also describes variable-speed, forced-convection cooling and fan zones, where fans serving less-stressed areas can operate below the speed needed by a hotter zone. This is a better starting point than applying one percentage reduction to every fan.
The practical question for an engineer or buyer is: at the proposed part-load command, what airflow reaches the heat sink or rack, what pressure remains in the distribution path, and what temperature margin is left at the highest-load GPU? This article turns that question into a measurement plan.
Start With the Thermal Load and the Required Air Mass
Fan selection begins with the heat that must leave the component, not with a rack's nameplate power alone.
For a first air-side estimate, use Q = P/(rho x cp x delta T). If an air-cooled server zone rejects 12 kW, the air density basis is 1.18 kg/m3, cp is 1,005 J/kg-K and the permitted air temperature rise is 10 K, the estimated flow is 12,000/(1.18 x 1,005 x 10) = 1.01 m3/s, or approximately 3,640 m3/h. That number is a heat-balance estimate. It does not include fan-system pressure, bypass leakage or the fact that the hottest GPU may need more local flow than the average rack.
When the data center operates at altitude or at a higher inlet temperature, density changes. The same volumetric flow carries a different mass of air and therefore a different heat load. State the density basis and the inlet temperature in the requirement. Otherwise two suppliers can quote apparently different fan performance using different reference conditions and both appear correct.
For hybrid liquid cooling, do the same separation used in a rack thermal review: the cold plate and coolant loop remove the heat that reaches the liquid path, while fans still cool memory, VRMs, storage, power supplies, controls and the air side of a CDU or heat exchanger. A lower server fan duty does not mean a zero fan duty.
Animated Model: Part-Load Fan Power Versus Useful Rack Airflow
The moving particles show a qualitative control response; they are not a CFD result or a PUE guarantee.
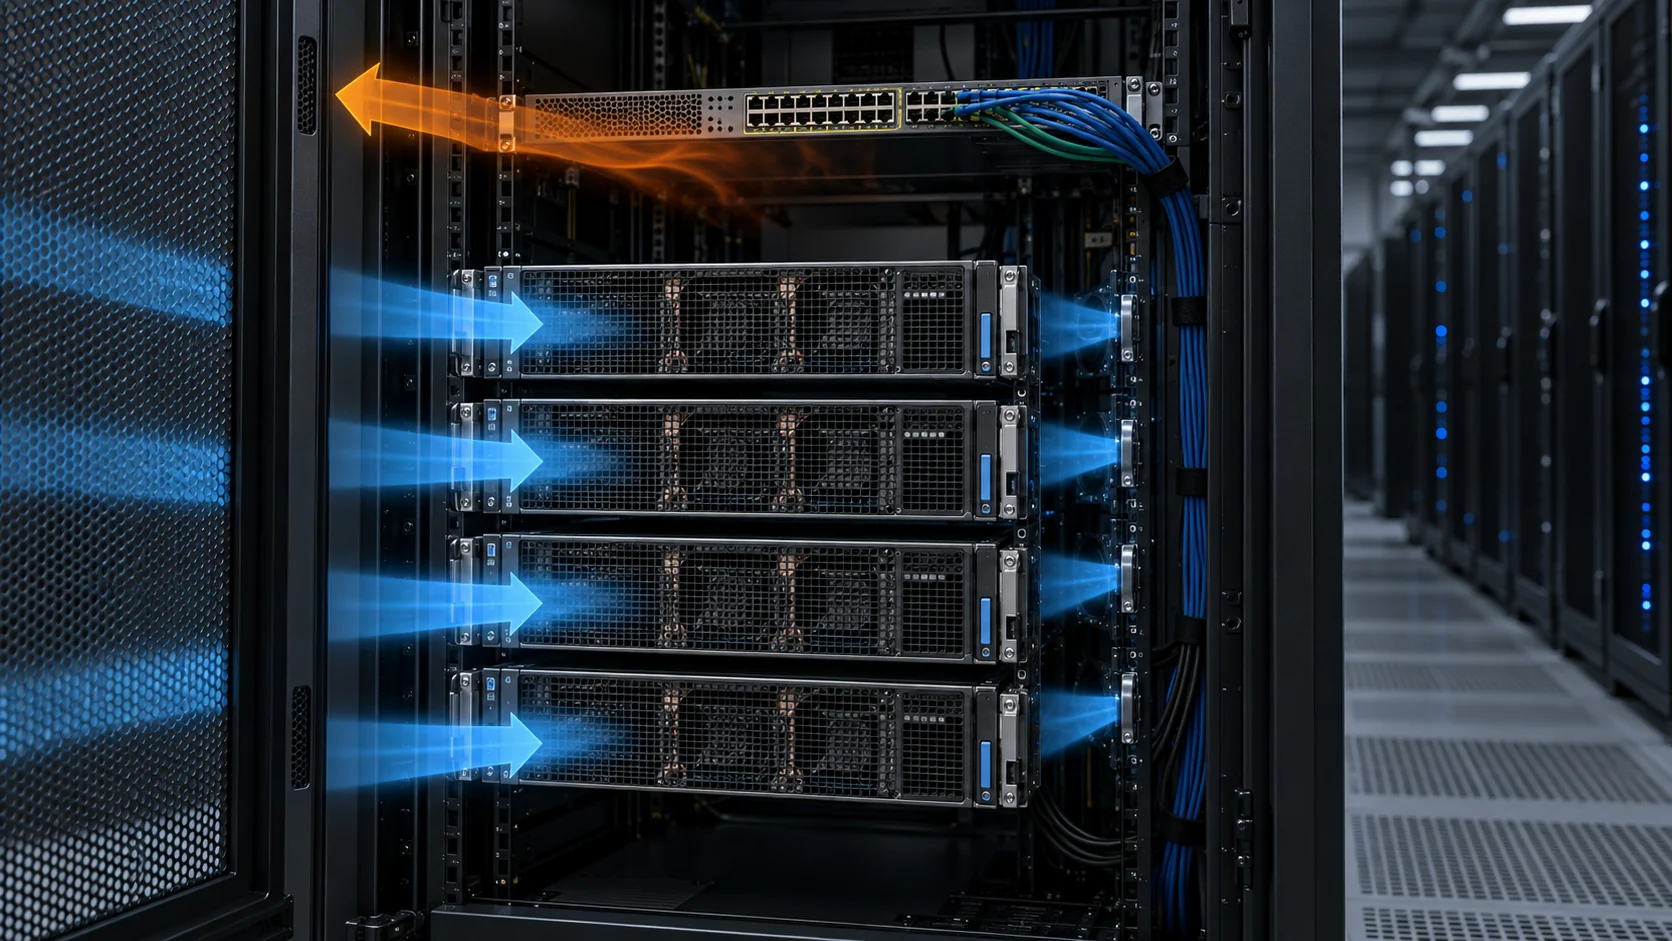
In the useful part-load state, the controller reduces speed because the thermal load has fallen, while the rack pressure remains high enough to distribute air through the intended server inlets. In the bad state, the speed command falls below the pressure needed by the distribution path. Air finds easier openings, the average room flow can look acceptable, but the highest-resistance rack receives less useful air.
A fan-power comparison should therefore report at least fan electrical power, rack inlet pressure, delivered airflow or calibrated proxy, inlet temperature, outlet temperature and the workload state. A lower watt number without the other channels is an energy number, not a cooling result.

Fan Laws Help, but the System Curve Still Decides the Working Point
At the same fan size and air density, the affinity laws provide a useful estimate: flow changes with speed, pressure with speed squared and power approximately with speed cubed.
If a fan runs from 100% speed to 80% speed, the idealized estimates are about 80% of the flow, 64% of the pressure and 51% of the power. Those relationships are useful for screening, but they are not a license to promise a 49% saving in the installed cabinet. The actual operating point is the intersection of the fan curve and the system curve. If the system pressure falls sharply at the lower flow, the result can differ; if a damper, coil or filter dominates the path, it can differ again.
A practical example uses a rack path that requires 180 Pa at 1,000 m3/h. The fan reaches that point at 100% command. A proposed 80% command may produce an estimated 800 m3/h and 115 Pa fan pressure. If the rack path still requires 115 Pa at 800 m3/h, the point may be valid. If the required path pressure is 145 Pa because a containment damper or filter state is different, the fan cannot meet the duty at that command. The missing 30 Pa becomes reduced flow, leakage or a higher upstream pressure demand.
Use measured pressure and flow at several commands to build an installed curve. Do not infer it from the maximum CFM line. ASHRAE also warns that fan pressure terminology and measurement planes matter; a static pressure reading at an arbitrary location may not equal the fan pressure that overcomes the system loss.
| Control state | Electrical record | Air and thermal record |
|---|---|---|
| Low workload | Fan command, voltage, current and fan watts | Rack inlet pressure, airflow, inlet temperature and hottest component temperature |
| Nominal workload | Fan command, RPM, power and control mode | Flow distribution, pressure margin, outlet temperature and thermal throttling state |
| Power step | Time response, startup or ramp behavior | Peak component temperature, recovered airflow and pressure settling time |
| High ambient | Fan inlet temperature, motor or electronics temperature | Density basis, delivered airflow and remaining thermal margin |
| Degraded path | Power at the same command and alarm state | Filter or damper pressure, bypass flow and service threshold |
Server Fan, Rack Fan Wall and Facility Fan Are Different Loads
Do not use a server-fan result to approve a facility fan wall, or a fan-wall setpoint to approve a server module.
A server fan sees heat sinks, cold plates, memory channels, cable openings, drive bays and chassis grilles. Its pressure curve is compact and its control may respond to local component sensors. A rack or fan-wall array sees aisle pressure, containment openings, blanking panels, rack leakage and the resistance of multiple server inlets. A CRAH or facility fan may see coils, filters, dampers and distribution ductwork. Each layer can have a different optimum speed.
This layering explains why a lower facility fan speed can sometimes increase server fan power. If cold-aisle pressure falls, server fans may speed up to preserve component temperature. The facility meter may show less fan-wall power while the IT equipment consumes more. The correct PUE comparison measures both sides of the boundary and keeps workload constant.
The same logic applies to redundancy. If one fan module is off, the remaining modules may experience a different pressure and flow point. An idle fan can also become a reverse-flow opening. Validate the one-module-out condition with the actual damper, backdraft prevention and fan spacing, not only with an ideal arithmetic sum.
Sensors: Rack Pressure Is Not the Same as Server Inlet Temperature
A controller can use either variable, but the meaning of the control loop changes.
A cold-aisle pressure loop protects distribution pressure. An inlet-temperature loop protects the equipment at the sensor location. A return-air temperature loop protects a broader thermal zone but can miss a local hotspot. ASHRAE describes pressure, supply temperature, return temperature and containment signals as possible control inputs. The right choice depends on the air-delivery architecture.
Sensor placement is part of the fan specification. A pressure sensor too close to a fan outlet can read a local jet rather than the rack plenum. A temperature sensor in a well-mixed return stream can be slow to respond to a GPU inlet excursion. Put the sensor where the control decision is made, then validate the lag and the worst-case rack rather than tuning against a convenient point.
Use hysteresis and rate limits to prevent fan hunting. If the loop reacts to a noisy sensor, the fan may repeatedly cross its minimum stable speed, producing acoustic variation and additional bearing cycling. A stable pressure band with a defined response to a power step is more valuable than a nominally aggressive controller that oscillates.
Acoustics and Reliability Are Part of the Energy Decision
A lower average watt number is not a complete optimization if it creates tonal noise, repeated speed cycling or a shorter service life.
Fan acoustic performance depends on blade-passing tones, turbulence, grille interaction, rack geometry and speed. A lower RPM can reduce broadband noise while a control loop may create a new tonal component during repeated speed transitions. Measure at the operating point and include the final guard, grille, containment panel and neighboring fans.
Reliability also follows the duty profile. A fan that runs at high speed only during short AI workload bursts has a different thermal and bearing duty from one that operates continuously at high speed because the pressure setpoint is too conservative. Record speed histogram, start-stop count, ambient temperature and contamination state. A replacement fan should be compared on these conditions, not only on nominal L10 hours.
For procurement, ask for operating-point data at the voltage and density used in the rack, acoustic data at the same point, feedback behavior, life assumption and failure response. The lowest purchase price can be a poor choice if a signal mismatch forces the controller into a higher fallback speed.
A Commissioning Example: The Facility Saved Power but the Server Fans Sped Up
The useful fix was a pressure reset and sensor-location change, not a blanket fan-speed reduction.
Consider an anonymized AI rack row where the facility fan wall was reduced from a conservative pressure setpoint during low workload. Facility fan power fell, but server fan power increased and two high-density racks showed a larger inlet-temperature spread. The average room airflow looked normal because leakage around a partially open containment path increased as pressure fell.
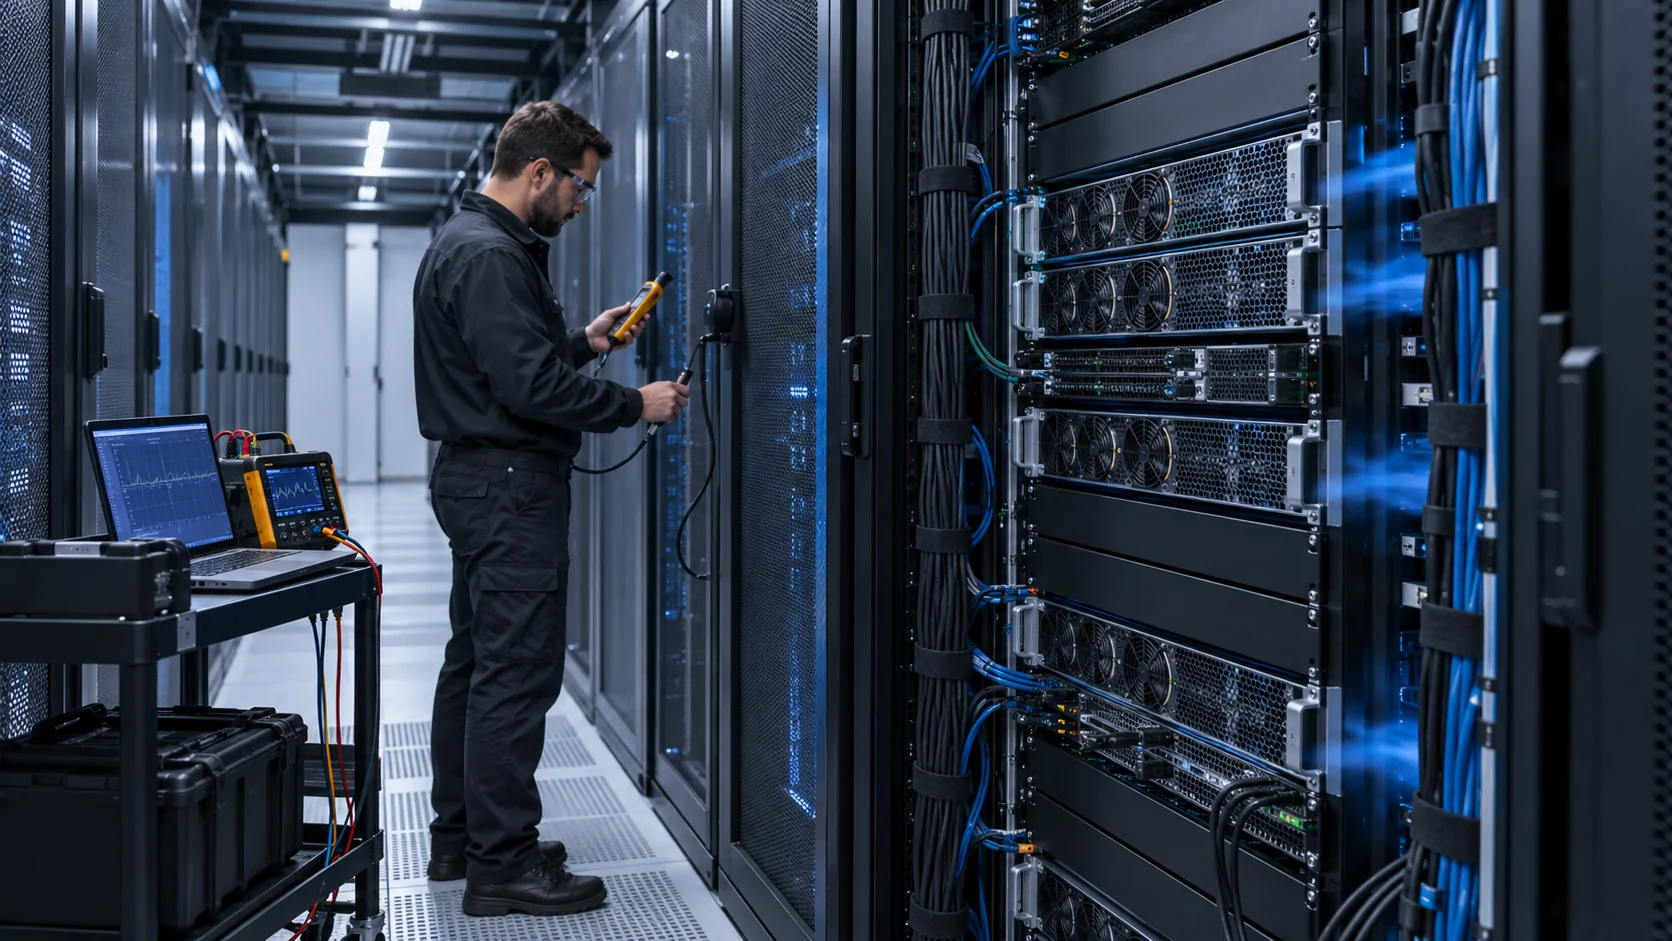
The team mapped rack inlet pressure at the first, middle and last racks, then compared the readings with server fan telemetry and workload. The first rack had adequate pressure while the far rack was pressure-starved. A trim-and-respond reset was then constrained by the least-satisfied rack rather than by the average pressure. Blanking panels and the containment gap were corrected before the setpoint was reduced again.
The result was recorded as a control envelope: minimum pressure, maximum allowed inlet temperature, server fan-power response, and one-rack-out behavior. No universal saving percentage was claimed. The transferable lesson is that facility fan power and server fan power must be optimized together.
Build a Fan-Power Budget Instead of Quoting One Efficiency Number
PUE is a facility metric, but the fan-power decision is made across several electrical and airflow boundaries.
A useful budget separates server-fan power, rack or row fan-wall power, CRAH or CRAC fan power, pump power for liquid systems and the control or sensor power required to operate them. It then records the IT workload, inlet condition, airflow mode and pressure setpoint for each measurement. Without the boundary, a claimed fan saving can simply move work from one motor to another or increase the server's internal thermal resistance.
For the fan itself, use the electrical input at the fan connector or controller output, not only the motor's nominal efficiency. A 24 V DC fan drawing 2.0 A at a particular operating point consumes approximately 48 W before the upstream conversion loss. If the controller or power supply adds 8%, the facility-side number is about 52 W. That small distinction matters when a row contains dozens or hundreds of fans and when a part-load comparison is made against AC or EC equipment with different conversion boundaries.
Do not use a single full-load number to represent a variable-speed installation. Record at least three states: low workload, representative production workload and the worst normal thermal workload. Add a power-step trace so the team can see the time required for the fan control to reach a stable airflow and the temperature peak that occurs before it gets there. A controller that saves watts in steady state but responds too slowly to a GPU power step may fail the actual design objective.
The pressure setpoint should also be part of the budget. A high setpoint may force more facility fan power than necessary, but a low setpoint can make server fans accelerate, increase noise and create rack-to-rack imbalance. A pressure reset strategy should be limited by the least-satisfied rack or zone, with a clear lower bound and a documented sensor location. The lower bound is a thermal acceptance value, not an arbitrary percentage of the maximum command.
Procurement should receive the budget in a form that can be reproduced. State the voltage, density, temperature, measurement plane, power boundary, number of operating fans, controller mode and workload. If the supplier offers a custom fan or a replacement for a named brand, request the same data at the same installed operating point. A lower price is meaningful only after the thermal, acoustic, feedback and service evidence still matches the project requirement.
| Field | Why it changes the conclusion | Record it as |
|---|---|---|
| Power boundary | Conversion and controller losses can be counted on different sides | Fan connector, controller output or facility input |
| Workload state | GPU and CPU power changes the thermal demand and fan command | Fixed workload name plus measured IT power |
| Pressure setpoint | A lower setpoint may raise server fan power or create bypass | Rack or aisle pressure at the sensor and farthest rack |
| Air density | Temperature and altitude change mass flow and fan pressure | Inlet temperature, altitude and density basis |
| Airflow evidence | Average room flow can hide a starved rack | Rack flow, proxy measurement or calibrated pressure correlation |
| Control response | Slow ramps can allow a thermal peak before airflow arrives | Command, pressure and temperature time trace |
Filters, Blankers and Leaks Can Erase the Part-Load Saving
The fan does not know whether a pressure change came from a useful heat sink, a blocked filter or an open containment gap.
In a chassis, dust filters and grilles add resistance before the fan, while heat sinks, cable bundles and blanking panels add resistance after it. In a room, the equivalent elements are floor tiles, dampers, containment curtains, rack doors and unsealed openings. A fan power test on an open bench removes the very resistance that determines the real operating point.
For a part-load study, test both the clean and degraded state that the maintenance plan allows. If a filter is replaced at a measured differential pressure, use that pressure in the fan selection. If a containment opening is intentionally allowed for service access, test it in the open and closed states. If a rack is missing blanking panels, record the leakage rather than treating the extra room airflow as useful server cooling.
A simple diagnostic is to compare fan command, rack pressure and component temperature while changing one resistance at a time. If power rises without a corresponding useful-flow increase, the system may be pushing air through a new bypass or a blocked element. If pressure falls while average airflow remains unchanged, the distribution may have become less uniform. These observations are more actionable than a single CFM value printed in a quotation.
Part-Load Acceptance: Five Tests Before the Energy Claim
A credible fan-power claim survives the same installed tests that the rack must survive in service.
Test one is the steady low-workload state. Verify that the minimum command produces stable speed and that the farthest rack remains inside the pressure and inlet-temperature band. Test two is the representative production state. Record fan watts on both the IT and facility sides, plus the rack distribution map. Test three is a controlled power step. Measure the peak temperature, command ramp, pressure recovery and time to settle.
Test four is the degraded air path. Apply the defined filter pressure, service opening or containment leakage and repeat the steady and step tests. Test five is redundancy. Remove one fan module or place it into the documented fault state, then verify remaining airflow, reverse-flow behavior, pressure and thermal response. These tests should use the final grille, damper, harness, controller and measurement locations.
The pass/fail criteria should be written before the test starts. Examples include maximum server inlet temperature, minimum far-rack pressure, maximum facility fan power at a fixed IT load, allowed server-fan power increase, maximum alarm latency and maximum acoustic level. The exact limits belong to the project, but the measurement channels must be explicit. This keeps a fan supplier, server integrator and facility team from each using a different definition of success.
What MEGA Tech Can Validate for AI Data-Center Cooling
We help turn the rack or chassis duty into a fan sample that can be evaluated at the real pressure and control state.
We can provide custom DC axial fans, compact blowers and backward-curved centrifugal fans for server chassis, electronics bays and defined air-side cooling paths. We review airflow and static pressure at the installed operating point, voltage tolerance, PWM or analog command, FG/RD feedback, connector, acoustic target, envelope and duty cycle. Samples can be tested in the customer's chassis, rack module or representative pressure fixture.
Send the heat load or component loss, airflow target, static-pressure target at that airflow, density basis, inlet-temperature limit, pressure-sensor location, control curve, minimum and maximum speed, voltage, connector, cable length, noise limit, quantity and life assumption. For a fan wall, include the number of modules, spacing, failed-module state, damper or reverse-flow behavior and the pressure measurement plane.
We do not supply the data-center room, containment, CRAH, CDU, chilled-water loop, BMS or PUE guarantee unless a separate verified scope says otherwise. Our role is to make the fan and its installed operating point measurable, support custom samples and help compare alternatives by performance and validation evidence rather than by a catalog CFM headline.
Engineer FAQ: AI Data-Center Fan Power and Part-Load Control
Short answers for thermal, facility and procurement teams.
Q: Does reducing fan RPM always reduce PUE? A: Not automatically. Measure facility fan power, server fan power, rack pressure, airflow and thermal response together at a constant workload.
Q: Can I use the fan cube law as the energy result? A: Use it as a screening estimate. The installed working point changes with system resistance, air density, dampers, filters and leakage.
Q: Why can lower cold-aisle pressure increase server fan power? A: Server fans may accelerate to protect component temperature when the facility path no longer supplies the required inlet pressure or airflow.
Q: Which sensor should control a fan wall? A: Pressure, supply temperature, return temperature and containment signals can all be valid. Choose the variable that represents the least-satisfied thermal zone and validate sensor lag and placement.
Q: What should a fan supplier receive for a custom sample? A: Airflow and static pressure at that airflow, density basis, voltage, PWM or analog command, feedback signals, envelope, noise, environment, quantity and life assumption.
Q: Does a normal fan curve prove N+1 operation? A: No. Test the failed-module state, reverse-flow path, remaining fan pressure and rack temperature with the actual array geometry.
Questions for a Design Review
Use these questions before approving a part-load fan-power claim.
- Are server-fan watts and facility-fan watts measured together at the same workload?
- What pressure and airflow does the farthest or most restricted rack receive at the proposed minimum setpoint?
- Which system curve and fan curve define the installed operating point at 100%, 80% and minimum command?
- What density, inlet temperature and altitude basis is used for the airflow and power comparison?
- Where are pressure and temperature sensors located, and what lag or filtering does the control loop add?
- Does the control remain stable at minimum speed, during workload steps and when one fan module is unavailable?
- What acoustic and reliability evidence exists at the same operating points used for the energy claim?
- What exact information will be sent to the supplier for a custom fan sample?