Why a quiet catalogue fan can be loud in the product
Fan noise is not a single property of the rotor. It is the result of speed, airflow, pressure, turbulence, structure and the enclosure around it.
A datasheet noise value is useful only with its operating point and test method. The same fan can produce a different acoustic result when a grille, filter, heat sink or short outlet changes the airflow, or when the frame is mounted to a thin panel that amplifies vibration.
The first engineering question is therefore not “what is the lowest dB-A fan?” It is “at the required airflow and pressure, what noise reaches the listener or sensitive component after the fan is installed?”
- Compare noise at the required operating point, not free delivery only.
- Separate airborne noise from structure-borne vibration.
- Record the enclosure, grille, filter and mounting used in the test.
- Treat tonal peaks as a separate risk from overall dB-A.
dB-A is a result, not a complete test description
A single A-weighted number compresses a complex sound field into one value. It does not identify where the noise comes from or whether a narrow tone will be objectionable.
Ask whether the result is sound pressure or sound power, where the microphone was placed, what the background level was, which operating point was used and whether the measurement was made in free air, a duct, a reverberation room or the finished product. These conditions determine how a comparison should be interpreted.
AMCA 300-24 requires the fan's aerodynamic point of operation to be established and records background and fan sound pressure in one-third-octave bands. ISO 13347-3:2026 describes a standardized sound-power method but notes that its laboratory arrangements are not intended to represent every field installation.
- State sound pressure or sound power explicitly.
- Record distance, room, background noise and operating point.
- Use frequency bands when tonal noise matters.
- Do not compare numbers produced by incompatible test setups.
Find the operating point before changing the fan
Noise can rise sharply in parts of the fan curve. Changing fan size without knowing the installed point can trade one problem for another.
Plot the system resistance and identify the required airflow and pressure. Then compare candidate fans at that point, including the speed range available from PWM or voltage control. A fan that is quiet at free delivery may be working near a high-speed or unstable region once the filter and heat sink are installed.
If the fan is too loud, review the whole chain: a larger frame at lower speed, smoother inlet flow, more open grille, shorter restriction, better outlet separation, vibration isolation or a different fan geometry may all help. Do not lower speed until the thermal margin has been checked.
- Map noise to the same P-Q operating point used for thermal selection.
- Check speed, pressure, power and temperature together.
- Review inlet and outlet turbulence before replacing the motor.
- Use the lowest speed that still preserves the required thermal margin.
Make the acoustic number traceable
A reported dB-A value is only decision-grade when the quantity, operating point and measurement conditions are traceable.
Sound pressure is tied to a microphone position and room. Sound power is calculated from measurements around the source and is more useful for comparing sources, but it still belongs to a specified installation category and test method. Do not compare a catalogue sound-power value with an in-product sound-pressure limit as if they were the same quantity.
For a standardized fan test, record the aerodynamic point, RPM, airflow, pressure, background noise, microphone arrangement, frequency bands and corrections. ANSI/AMCA 300-24 requires the point of operation to be established and fan sound pressure to be recorded in one-third-octave bands. ISO 13347-3:2026 also cautions that laboratory arrangements rarely reproduce every field installation, where inlet and outlet system effects can add noise.
- Label every limit as sound pressure or sound power.
- Keep airflow, pressure and RPM with the acoustic result.
- Record background correction, microphone geometry and frequency-band data.
- State the test installation and do not present a laboratory value as a field guarantee.
- Report repeatability or measurement uncertainty when comparing close results.
Tonal noise and vibration often reveal the real cause
A fan can have an acceptable overall dB-A value and still create an irritating tone, resonance or vibration path through the product chassis.
Tonal components can come from blade-passing frequency, motor commutation, PWM interaction, bearing noise, turbulence or a structural resonance. The frequency and amplitude can change with RPM, duty cycle, grille geometry and panel stiffness. A narrow peak deserves attention even when the total level looks modest.
Check the fan and the enclosure separately where possible. If the tone follows RPM, investigate rotor, motor and control behaviour. If it follows a panel or bracket mode, investigate mounting torque, flatness, isolators and stiffening. If it appears only with a grille or heat sink, inspect flow separation and recirculation.
- Sweep speed and record the spectrum, not only total dB-A.
- Check blade-passing and PWM-related frequencies.
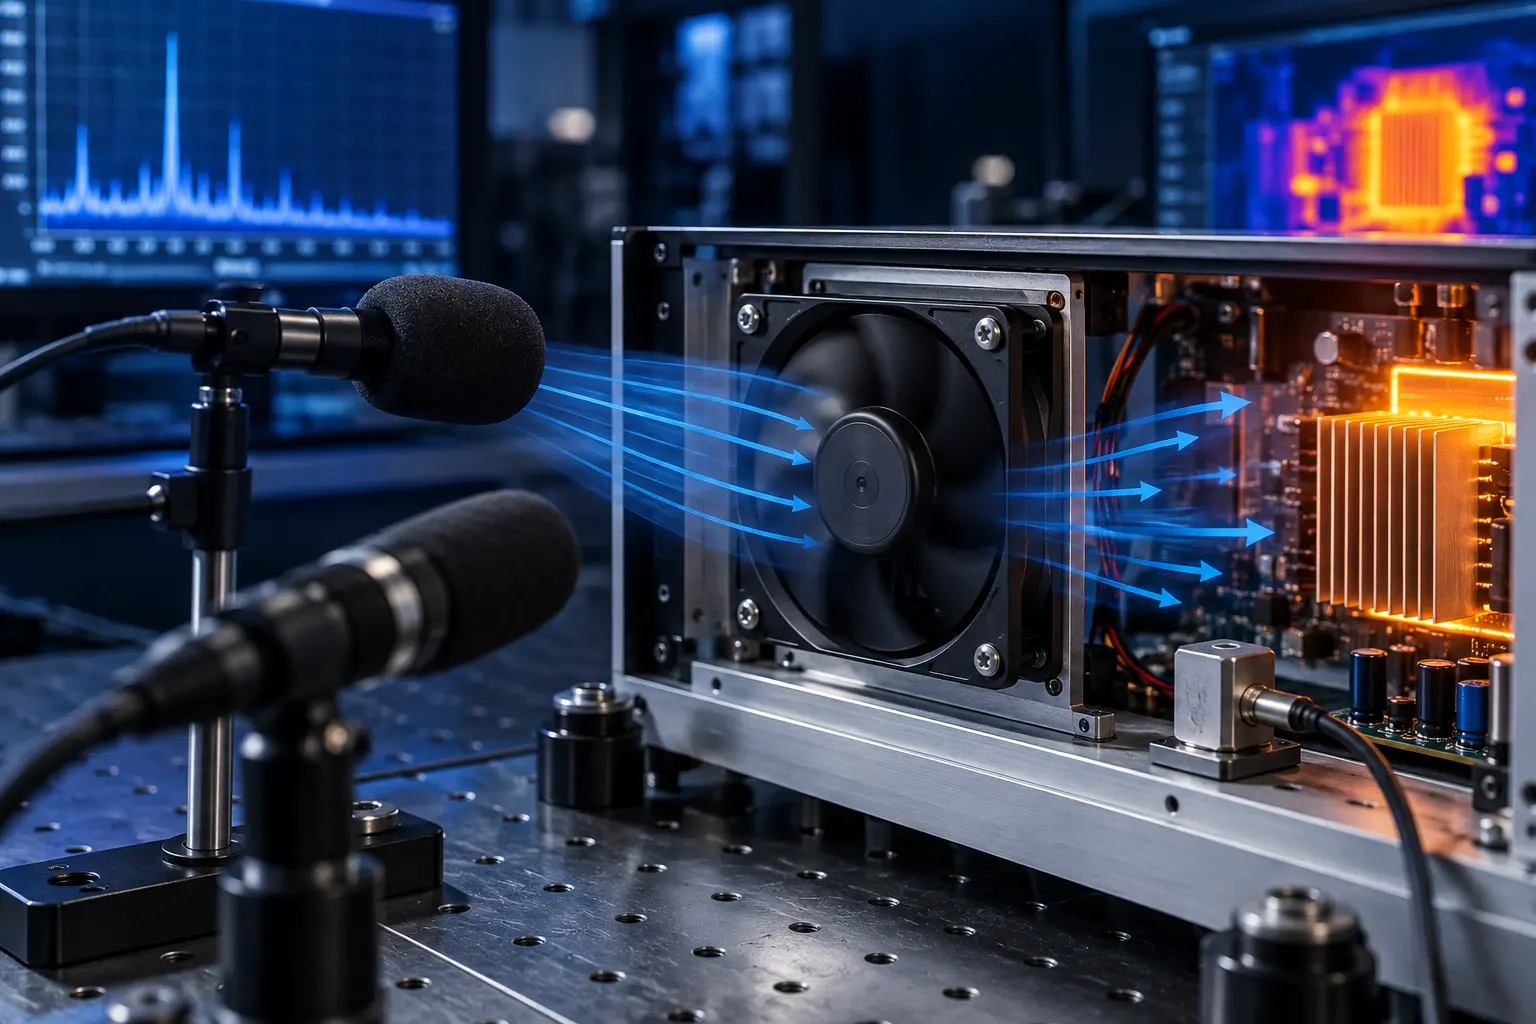
- Use an accelerometer or vibration measurement when panels amplify noise.
- Inspect mounting torque, frame flatness and bracket resonance.
A sample test engineers can repeat
A useful acoustic test is a controlled comparison that preserves the thermal operating point and documents the conditions another team can reproduce.
Mount the candidate fan in the representative enclosure with the final grille, filter, heat sink, cable routing and controller. Measure the fan inlet temperature, airflow or velocity, static pressure, RPM, current, power, component temperature and noise together. Record the background level and microphone position.
Run the normal point, the peak thermal point and the relevant speed range. Check hot and cold startup if the product cycles, and repeat after the enclosure reaches thermal steady state. For a customer acceptance test, define the maximum overall level and any tonal or vibration limits before the sample is evaluated.
- Use the final mechanical installation or a representative fixture.
- Measure thermal and acoustic data at the same operating point.
- Record background, microphone position, RPM and control duty.
- Check speed sweep, hot operation, startup and fault behaviour as required.
- Define both overall-noise and tonal/vibration acceptance limits.
Engineer FAQ: fan noise in real enclosures
These questions prevent a low catalogue dB-A value from becoming a high-risk product assumption.
Q: Is dB-A enough to select a quiet fan? A: No. Confirm the operating point, test method, background, distance, frequency content and installed geometry.
Q: Why is the installed fan louder than the datasheet? A: The enclosure can add turbulence, reflection, resonance and structure-borne vibration, while the installed point may require a higher speed.
Q: Should we compare sound pressure or sound power? A: Use the quantity appropriate to the decision, and do not compare them as if they were interchangeable. Sound pressure depends strongly on location and environment.
Q: Why ask for one-third-octave data? A: It helps reveal narrow tonal components that a single A-weighted value can hide; the exact band resolution and acceptance method should match the product requirement.
Q: Can PWM reduce noise? A: It can reduce speed and airflow noise when thermal margin permits, but the PWM frequency, motor behaviour and minimum-speed range must be validated.
Q: What should a supplier provide? A: Noise data tied to airflow, pressure, RPM and test method, plus the control response, mounting limits and a sample test plan for the real enclosure.
- Noise must stay attached to airflow, pressure and RPM.
- Tonal noise and vibration need separate checks.
- A real enclosure test closes the gap between catalogue and product.
- Thermal margin must be protected when reducing speed.
- Close acoustic comparisons need a documented test boundary and uncertainty.