A Single Airspeed Reading Is Not Enclosure Airflow
A probe near the fastest part of a fan outlet can give a convincing number and still tell you almost nothing about useful cooling through the product.
Cooling air exits an axial fan with a non-uniform velocity field, swirl and a hub region that does not behave like a straight duct. Once it meets a grille, bend, cable bundle, heat sink or bypass gap, the field changes again. Measuring one point, multiplying by an opening area and calling the result CFM can overstate, understate or simply fail to represent the flow that reaches the protected component.
ISO 5802 treats in-situ fan performance as a coordinated measurement problem. Pressure, velocity, temperature, air density and rotational speed all matter, and the choice of pressure plane and flow-measurement method matters. AMCA field-performance guidance similarly focuses on acceptance methods, instruments, limitations and expected accuracy rather than a single universal meter reading.
The practical objective for an electronics team is rarely an accredited fan rating. It is a repeatable answer to a narrower question: does this assembled enclosure deliver enough air and temperature margin at the agreed voltage, command, restriction and ambient condition? A well-designed comparative test can answer that without pretending to reproduce a laboratory catalogue curve.
First Decide What You Need to Prove
A comparison test, an enclosure acceptance test and a catalogue P-Q test serve different purposes. Confusing them produces false confidence.
For an early custom-fan comparison, a controlled relative test can be useful: hold enclosure geometry, supply voltage, PWM command, filter, cover and ambient condition constant, then compare candidate A and candidate B using the same pressure and temperature measurements. The result ranks candidates in that assembly; it is not a transferable free-air CFM rating.
For product acceptance, define the thermal requirement first. Identify the protected hot spot, the maximum permitted temperature, the normal and degraded airflow path, the voltage and command range, and the measurement repeatability needed to make a release decision. Airflow evidence then supports the temperature result instead of replacing it.
For a published fan curve or contractual aerodynamic rating, use the relevant controlled laboratory method and documented uncertainty. Do not relabel a bench comparison as AMCA or ISO-certified performance unless the full test basis actually meets that method.
| Decision | Useful evidence | Do not claim |
|---|---|---|
| Choose between candidates | Same enclosure: pressure, temperature, RPM, power and a controlled flow indication | A catalogue airflow rating |
| Approve an assembled product | Hotspot temperature plus defined-path pressure or flow, normal and degraded conditions | That a normal RPM alone proves cooling |
| Publish aerodynamic performance | Controlled test method, instrumentation basis, density, speed and full curve | That a one-off enclosure test applies to every installation |
Interactive Model: Why Probe Position Changes the Answer
Move the probe through a simplified outlet plane. The velocity field is intentionally non-uniform, as it often is near an axial fan and nearby restriction.
The animation uses a schematic velocity map, not measurements from a MEGA Tech fan. It demonstrates a measurement principle: a single high-velocity sample near the blade path can produce a much larger estimate than the area-weighted average. A single low-velocity sample near the hub or wall can do the opposite.
A representative velocity traverse divides an appropriate measurement plane into multiple points and averages the results with the required area weighting. Where the geometry is too short, too turbulent or too close to the fan to establish a defensible velocity plane, use a different method or treat the result as a comparative indicator with stated uncertainty.
Choose a Measurement Plane Before You Power the Fan
The most expensive measurement mistake is choosing the probe location after the result is already needed.
Sketch the complete air path and mark the planes before assembly: ambient reference, enclosure inlet, fan inlet or outlet as appropriate, restriction before and after a filter or heat sink, and the protected component temperature. Each pressure tap needs a location that represents static pressure, not a point aimed into a high-velocity jet or recirculation pocket.
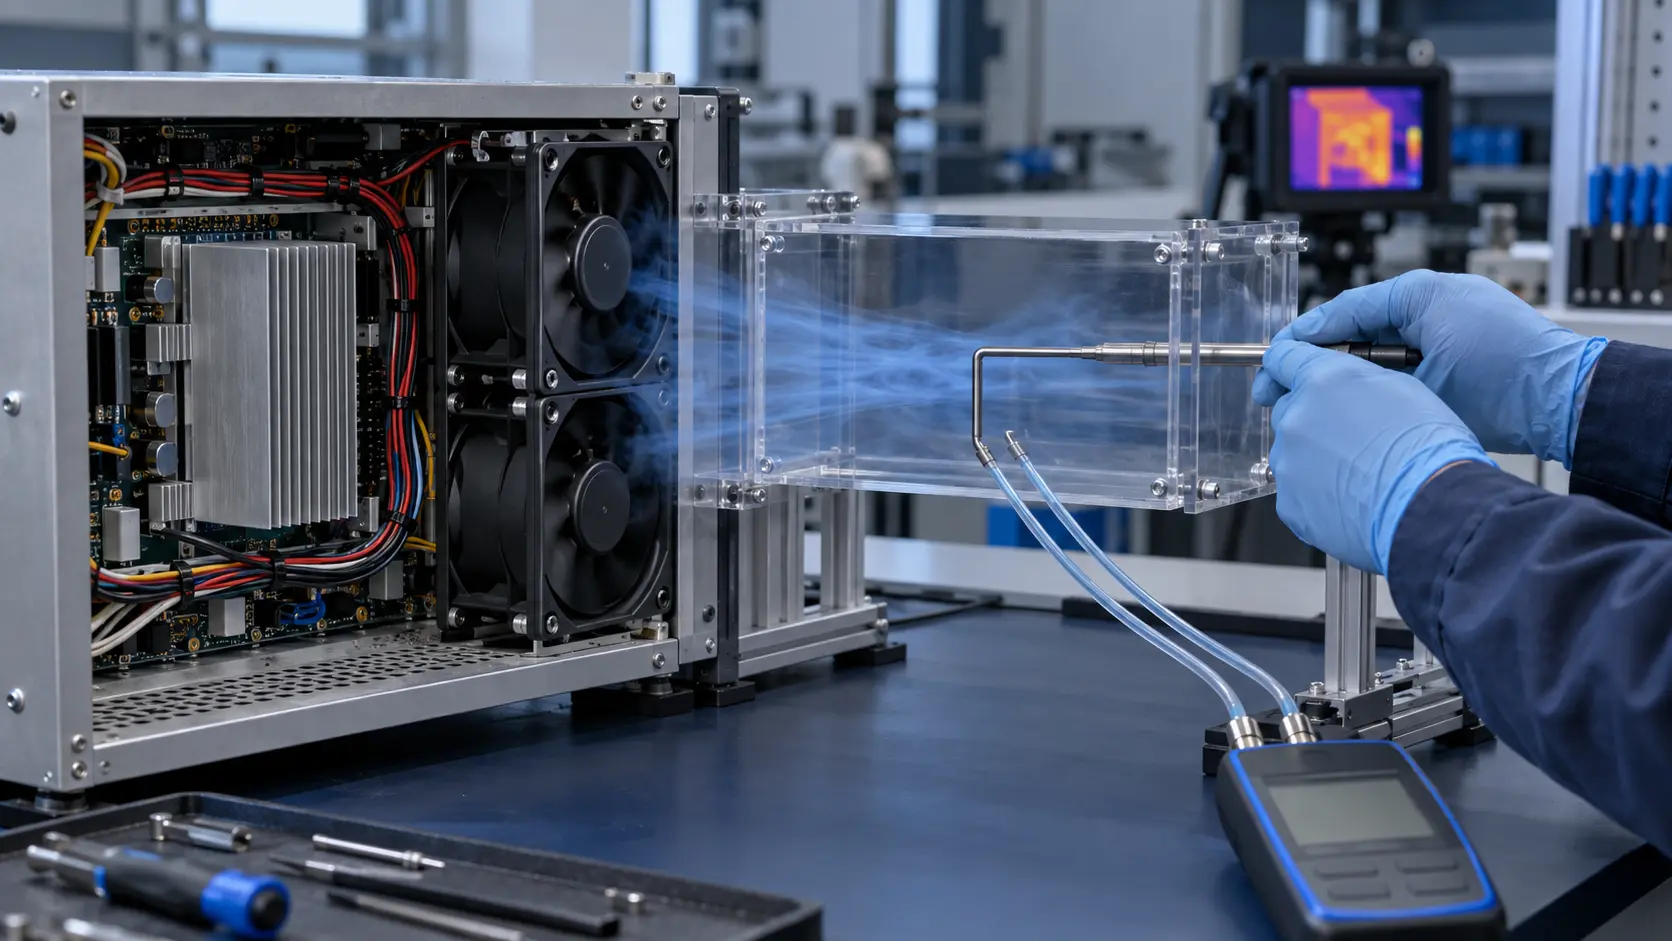
Where a ducted measurement section is available, select a section that avoids immediate bends, abrupt contractions, fan discharge swirl and leaks. If the product has no straight section, build a removable test adapter that represents the intended opening area and does not become a new dominant restriction. The adapter is part of the test configuration and must be documented.
A pressure difference across a known restriction can be more repeatable than trying to infer total enclosure CFM from a fan-face spot measurement. It still needs calibration or a known relationship, and it should be paired with thermal response and fan electrical data.
- Define the reference pressure and every pressure-tap plane on the drawing.
- Record inlet temperature, protected-hotspot temperature and ambient temperature.
- Record supply voltage, PWM command, actual RPM and input current with every run.
- Keep grilles, gasket compression, filter state, covers and cable routing unchanged between comparisons.
- Photograph the test assembly so a later sample is tested against the same boundary conditions.
Build a Small but Defensible Test Matrix
One good baseline and two credible stress conditions are more valuable than a long spreadsheet of uncontrolled readings.
Start at the agreed nominal voltage and control command with the production-representative cover, grille and clean filter. Log the time history until the relevant component temperature stabilises. Then repeat with the chosen degradation condition: service-state filter pressure drop, restricted vent, high ambient, low supply voltage or reduced PWM command, whichever actually defines the thermal risk.
Add a failure-oriented run if the product depends on fan redundancy or airflow alarms. A stopped fan may remain electrically visible as an RPM fault, but the more important question is whether the remaining flow path avoids backflow and keeps the protected component inside its temporary safe limit. Pair TACH and RD evidence with pressure and temperature rather than treating one signal as proof.
Repeat at least the baseline after any geometry change. If the readings move, do not assume the fan changed: check probe placement, filter seating, cover fit, cable position, instrument zero and ambient condition before declaring a design improvement.
| Run | Air-path state | Minimum record | Decision supported |
|---|---|---|---|
| Baseline | Representative cover, grille and clean filter | Voltage, command, RPM, current, pressure/flow indicator, hotspot temperature | Normal thermal margin |
| Degraded path | Agreed loaded filter or restriction condition | Same readings plus restriction definition | Service-state margin |
| Fault or low command | One-fan-down, low voltage or low PWM as applicable | Signals, pressure/flow indicator, temperature response and recovery | Protection and fallback behaviour |
Common Readings That Mislead Engineers
The instrument is rarely the only source of error. Boundary conditions and interpretation usually dominate.
A fan face is not a uniform duct plane. Placing a vane or hot-wire probe directly at the outlet can disturb the flow and sample a local jet, swirl or hub wake. A reading may still be useful for relative checks if the location and setup are fixed, but it should not be converted into a general airflow rating without a validated method.
RPM is not airflow. A fan can spin at its expected speed while a filter loads, a bypass gap opens, a duct collapses or exhaust air recirculates to the inlet. That is why an enclosure release record needs both an air-path indicator and a thermal response.
Temperature alone is not airflow either. A lower temperature can come from a lower heat load, lower ambient, a changed sensor contact or a longer soak time. Align electrical load, ambient, test duration and sensor attachment, then interpret the temperature result together with the path measurement.
Engineer FAQ: Measuring Airflow in an Enclosure
Use the method that matches the air path and decision, then document what the result means and what it does not.
Q: Can I calculate enclosure CFM from one anemometer reading? A: Not reliably when the velocity field is non-uniform, swirling or close to the fan. A fixed spot can support a comparative check, but a representative traverse, calibrated restriction or other validated method is needed for a defensible total-flow result.
Q: Is a pitot tube always the right choice? A: No. A pitot-based traverse needs a suitable plane, velocity range and pressure measurement. In a short or turbulent electronics path, a calibrated flow element, a controlled test adapter, differential pressure across a known restriction or a comparative method may be more practical.
Q: Which values should be logged with airflow? A: Record the enclosure configuration, ambient and inlet temperature, hotspot temperature, voltage, PWM or control command, actual RPM, current, pressure or flow measurement method, filter state and test duration.
Q: Why can normal RPM and low temperature still be a poor acceptance test? A: RPM does not prove the air path is open, while a temperature result without matched heat load, ambient, sensor placement and soak time may not be comparable. Use them together with a defined air-path indicator.
Q: What can MEGA Tech help validate on a custom sample? A: We can align the fan frame, pressure duty, voltage, PWM, feedback, bearing, connector and mounting with the representative enclosure and agree the sample test conditions before production approval.