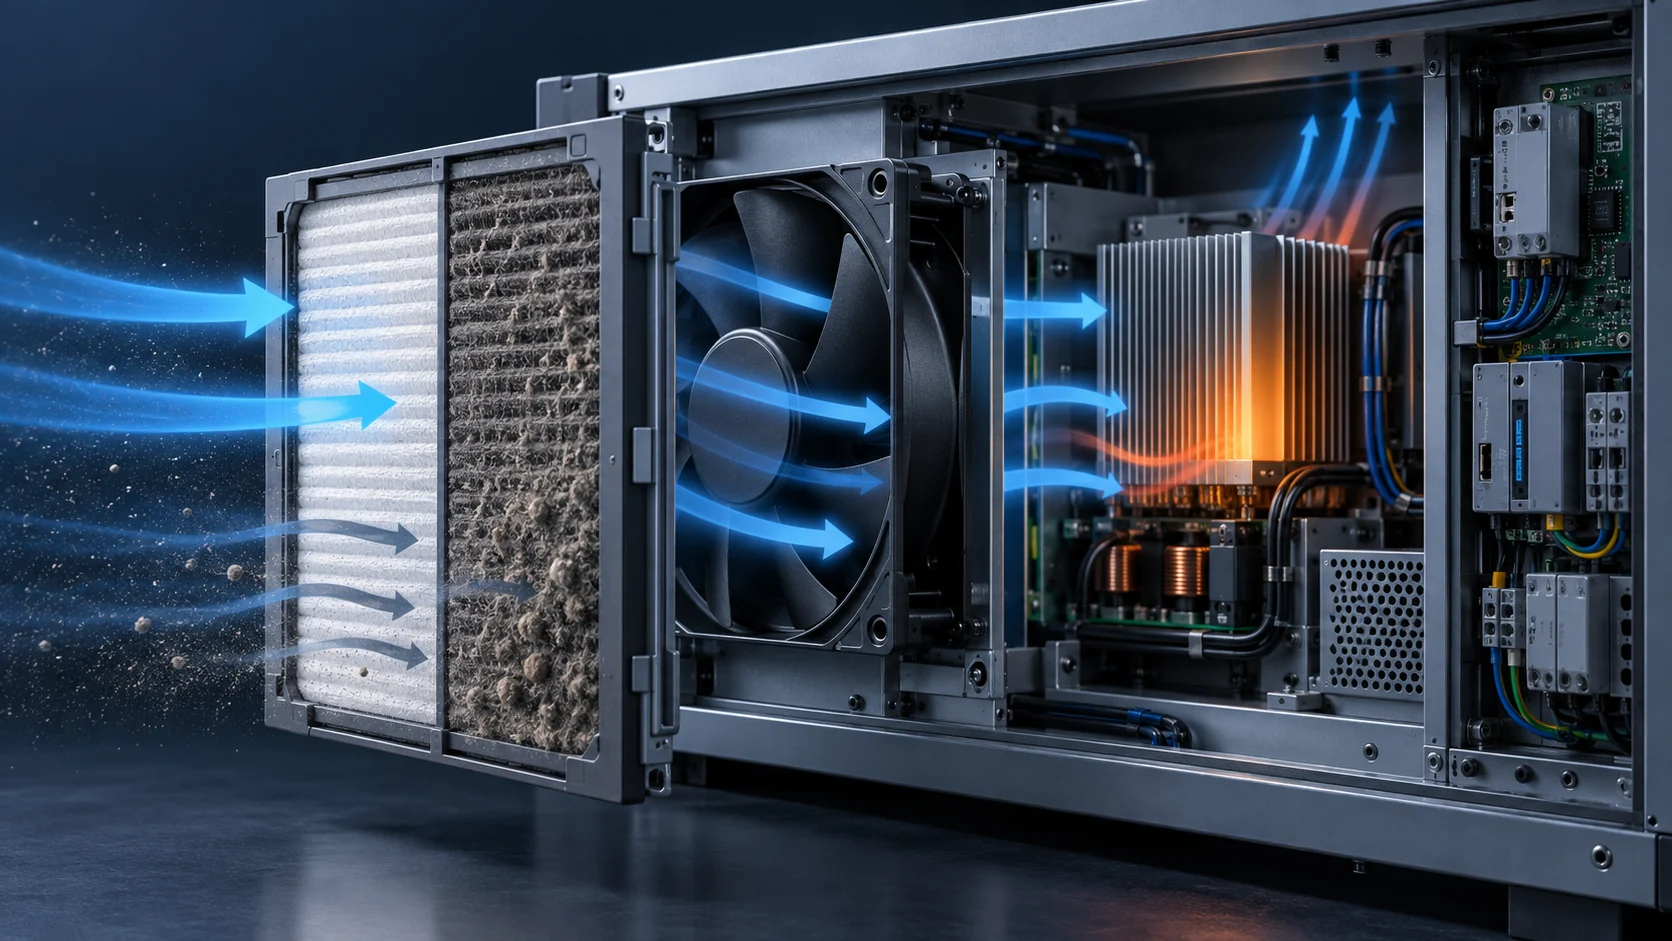
A fan selected against a clean filter can fail later
A filter is not a fixed pressure number. As dust loads the media, its resistance rises, and the fan operating point moves to lower airflow and higher pressure.
The usual mistake is to select a compact cooling fan from its free-air or clean-filter condition, then treat the filter as a fixed accessory. In a real cabinet the filter, grille, heat sink, bends and leakage path form one system curve. When the filter loads, that curve moves upward, and the fan settles at a new operating point unless speed, pressure capability and motor power have margin to spare.
This matters in controls, power electronics, telecom and industrial enclosures where dust protection is part of reliability. A falling airflow trend may be caused by restriction rather than by a failed fan - and simply raising the speed can trade the lost airflow for more noise, more motor heating and a shorter bearing life.
The trap is that a pressure-drop number feels like a specification. It is not: it is one input to a curve. The rest of this article sets out what filter makers actually publish, what the filter standards define and leave open, and how to convert a measured pressure rise into the airflow you will really get.
The filter resistance belongs in the system curve
Greenheck describes system resistance as the combined loss through components such as filters, dampers, coils and fittings, and its fan-performance guidance notes that dirty filters raise that resistance and change the airflow at a constant fan speed. ASHRAE treats fan selection the same way: the fan pressure capability has to be matched to the system pressure loss at the design condition, not to a headline airflow figure.
A system curve is simply the pressure the air path demands as a function of flow. Draw the fan curve and the system curve on the same axes and their intersection is the operating point. Everything that adds resistance - media, grille, bend, heat-sink fins, an undersized opening - lifts the system curve and moves that intersection down and to the left.
Two consequences follow. First, the installed airflow is always lower than the free-air figure, and the gap is not a defect. Second, a filter that loads does not lower the fan curve at all - the fan is unchanged - so any airflow loss is the system curve moving, which is why the diagnosis and the fix are different from a failing fan.
What filter-fan makers publish about the airflow you will get
Enclosure filter-fan makers publish their airflow at more than one resistance, which turns the theory into a checkable number. Rittal lists the TopTherm SK 3244100 - a 323 mm unit with a diagonal impeller - at 700 m3/h unimpeded with the standard chopped-fibre inlet mat, falling to 485 m3/h once a single outlet filter is fitted. That is about a third of the airflow removed by the exhaust path alone, with both filters clean.
The same unit shows a second effect. Fitted with a pleated inlet filter instead of the chopped-fibre mat it is listed at 855 m3/h, roughly a fifth more air, because pleating puts more media area in the same frame. Media geometry is not a detail; it is the difference between two published airflow figures for one fan.
Pfannenberg publishes the same pair of numbers. Its PF 66.000 is listed at 640 m3/h unimpeded and 445 m3/h in combination with the exhaust filter in the IP 54 version - about 30 % lost - and at 770 m3/h against 490 m3/h in the IP 55 version, about 36 % lost. Its PF 67000 SL is listed at 725 m3/h unimpeded against 580 m3/h in combination, and the outdoor-rated PF 65000 R at 297 CFM against 224 CFM.
Note what changes between the IP 54 and IP 55 columns of the PF 66.000: not the fan, but the filter medium, from a standard mat to a fluted one. The protection class you specify therefore changes the airflow you get, and both figures are legitimate published data for the same hardware. This is why an airflow target has to be stated together with the filter and the protection class, never on its own.
| Filter-fan unit | Airflow with the inlet filter only | Airflow with the exhaust filter as well | Share of airflow lost |
|---|---|---|---|
| Rittal TopTherm SK 3244100, 230 V, diagonal impeller | 700 m3/h with the chopped-fibre mat | 485 m3/h with one outlet filter | about 31 % |
| Rittal TopTherm SK 3244100, pleated inlet filter | 855 m3/h | 520 m3/h with one outlet filter | about 39 % |
| Pfannenberg PF 66.000, IP 54, standard mat | 640 m3/h | 445 m3/h | about 30 % |
| Pfannenberg PF 66.000, IP 55, fluted mat | 770 m3/h | 490 m3/h | about 36 % |
| Pfannenberg PF 67000 SL, IP 55 | 725 m3/h (427 CFM) | 580 m3/h (342 CFM) | about 20 % |
| Pfannenberg PF 65000 R, outdoor, Type 3R | 297 CFM | 224 CFM | about 25 % |
Three filter states to specify, not one
A usable fan specification separates the clean state, the normal loaded state and the final or alarm state. The clean state protects startup and the initial airflow. The normal loaded state represents the maintenance interval, which for an enclosure in a dusty plant may be most of the unit's life. The final state proves the equipment stays inside its thermal limits until the alarm or the scheduled replacement is reached.
For each state, record airflow, pressure, fan speed, supply voltage, current, input power, noise and the temperature of the critical components. If a controller raises speed as the filter loads, verify the maximum speed, the motor thermal margin, the acoustic limit and the bearing life at that speed, not at the nominal one.
A constant-airflow strategy preserves cooling, but it does not remove the extra electrical and acoustic cost of the restriction. It converts a thermal problem into an energy and noise problem, which is a legitimate trade only if someone has checked it.
| Filter state | What it proves | What to write down |
|---|---|---|
| Clean filter | Startup, the target airflow and the baseline noise | Fan curve point, supply current, component temperatures |
| Normal loaded | The cooling available at the service interval | Pressure drop, airflow, the temperature map at the critical component |
| Final or alarm | Safe operation until the alarm is answered | Alarm threshold, input power, worst-case component temperature |
| Blocked or abnormal | The protection response and that nothing is damaged | Fault test with the controller log, restart behaviour |
- State the airflow target together with the filter grade, the protection class and the airflow at which the target applies.
- Use the filter maker's pressure-drop curve at the real face velocity, not a single catalogue value.
- Keep the clean, loaded and final columns in one table so the margin is visible at a glance.
How the operating point moves when the filter loads
Take a fan whose curve is close to P = 300 - 0.008333 Q2 in Pa and CFM, which shuts off at 300 Pa and reaches about 190 CFM in free air. Suppose the clean enclosure demands 180 Pa at 120 CFM, so the clean system curve is 0.0125 Q2 and the fan delivers the design point exactly.
Now let the inlet filter load. A pleated media that starts at 50 Pa at 120 CFM can reasonably reach 110 Pa by the end of its service interval, which is a modest rise for a filter approaching its replacement point. The rest of the air path does not change, so the system demand at 120 CFM becomes 240 Pa and the loaded system curve is 0.0167 Q2.
Solving the two curves together gives the new operating point: about 110 CFM at 200 Pa. The system resistance rose by a third, but the airflow fell by about 9 %. That gap is not a curiosity - it is the reason a pressure reading cannot be converted into an airflow loss without the fan curve. A flat fan curve loses less flow for a given pressure rise; a steep one loses much more.
There is a second result worth checking before it surprises someone. The aerodynamic power the fan delivers is roughly the flow multiplied by the pressure, and in this example it barely moves: about 10.2 W clean against 10.3 W loaded. The restriction does not reward the fan with an easier duty. It absorbs the work, so the input current can stay close to its clean-filter value while the airflow quietly falls.
Figure B shows the same enclosure with the media loaded. The inlet pressure drop has roughly doubled, the system curve has moved up, and the operating point has slid down the unchanged fan curve. Fewer air parcels reach the equipment per unit time, and nothing on the fan itself looks different.

What the filter standards fix, and what they leave to you
ISO 16890 replaced EN 779 as the general-ventilation filter standard and classifies filters by their fractional efficiency against three particle size bands, reported as ePM1, ePM2.5 and ePM10. A filter belongs to a group only if its MINIMUM efficiency meets the threshold: ePM1 needs ePM1,min of at least 50 %, ePM2.5 needs ePM2.5,min of at least 50 %, ePM10 needs ePM10 of at least 50 %, and anything below that is ISO coarse.
The reported value and the group are computed differently, and confusing them is a real procurement hazard. The reported ePM figure is the average of the initial and the minimum efficiency, rounded down to the nearest 5 %, while the group is decided by the minimum alone. The published worked example makes the point: a filter with ePM1,min of 49.5 % and ePM2.5,min of 60.7 % is not ePM1 at all, and it is declared 75 % ePM2.5 because its ePM2.5 average is 79.1 %, rounded down.
The standard also defines the pressure-drop measurements. Initial pressure drop is measured at 50 %, 75 %, 100 % and 125 % of rated airflow and corrected to an air density of 1.20 kg/m3, which is an explicit acknowledgement that the relationship between flow and pressure drop is a curve rather than a number. Loading is then carried out at constant airflow with ISO 15957 L2 test dust at an upstream concentration of 140 mg/m3, and it stops when the pressure drop reaches 200 Pa for coarse filters or 300 Pa for ePM10, ePM2.5 and ePM1 filters. The dust captured up to that point is the dust holding capacity.
Those end points belong to the laboratory, not to your cabinet. A filter that reaches 300 Pa in a test duct may already have starved the electronics, or may have plenty of margin, depending on the fan curve and the heat load. The standard gives a repeatable way to compare filters; it does not tell you when your enclosure stops being safe.
It also cannot give you a service life in months. The loading test uses one dust at one concentration, so a dust holding capacity cannot be converted into an interval without knowing the dust concentration at the installation. For a cabinet in a foundry and a cabinet in a clean room the same filter can differ by an order of magnitude in time to reach the same pressure drop.
| What is defined | ISO 16890 | EN 779, withdrawn |
|---|---|---|
| Classification basis | Fractional efficiency in three particle size bands, ePM1, ePM2.5, ePM10 | Average efficiency at a single particle size |
| How the group is decided | By the minimum efficiency, not the average | By the average and a minimum efficiency for the fine classes |
| Loading end point | 200 Pa for coarse, 300 Pa for ePM10 and finer | 250 Pa for coarse, 450 Pa for the medium and fine classes |
| Loading dust | ISO 15957 L2 synthetic dust at 140 mg/m3 | ASHRAE dust |
| Initial pressure drop | Measured at 50, 75, 100 and 125 % of rated airflow, corrected to 1.20 kg/m3 | Measured at the rated airflow |
Pressure drop does not scale simply with airflow
Because the standard measures initial pressure drop at four airflow rates, a single catalogue value is only valid at the airflow it was measured at. Reusing it at a different face velocity is a common source of optimistic margin: denser media and higher face velocity both increase resistance, and a deeper or more heavily pleated element lowers it for the same airflow by spreading the same air over more area.
The practical rule is to obtain the maker's pressure-drop curve across the range of interest and read it at the actual airflow, rather than assuming an exponent. A quadratic relationship is a reasonable first estimate for losses in ducts, bends and openings, where the flow is turbulent and inertial effects dominate; a filter medium behaves differently, with viscous effects carrying more of the resistance, so the curve is flatter at low flow and steepens as velocity rises. Assuming the wrong shape moves the predicted operating point, and the error is largest where the filter is a big share of the total resistance.
Face area is the lever with the best return. Doubling the filter area halves the face velocity, which reduces the pressure drop by far more than half, at the cost of frame space rather than fan power. In an enclosure that is often the only change available that improves both the airflow and the maintenance interval at the same time.
- Read the pressure-drop curve at the airflow the enclosure will actually run at.
- Ask for the curve and not just the initial value, so the loaded state can be plotted.
- Prefer more filter area over more fan speed when both are possible.
- Check that the media grade and the protection class you need do not already cost a fifth of the airflow, as the published filter-fan data shows.
The alarm threshold is a decision about the equipment, not a filter number
A differential-pressure alarm is only useful if it fires early enough for someone to act and late enough not to fire constantly. Hanging it on the filter maker's final pressure drop is simple and usually wrong, because that value is a classification end point rather than a statement about your thermal margin.
The correct threshold comes from the other direction: establish the airflow at which the critical component approaches its limit, find the pressure drop that produces that airflow in your enclosure, and put the alarm below it. That is a test, not a calculation, because it depends on the heat sink, the internal air path and where the temperature sensor sits.
A fixed pressure threshold also breaks as soon as the airflow set point becomes variable. If a controller lowers the speed at night for noise, the filter pressure drop falls with the flow and a fixed threshold becomes insensitive; if it raises speed for a heat load, the same threshold fires early. The robust arrangement combines the filter pressure drop with the commanded speed and a temperature reading, and alarms on the combination.
Measurement practice matters too. A transducer should be selected with an accuracy that is small compared with the band between the clean and alarm values, mounted so its impulse lines cannot fill with dust or condensate, and zeroed at commissioning. An alarm threshold placed close to the clean reading will trip on a change of ambient pressure, not on dust.
Do not solve a filter problem with speed alone
Raising the speed is the obvious response to falling airflow, and the arithmetic behind it is unforgiving. For the same fan, airflow rises with speed and pressure capability rises with the square of speed, so shaft power rises with the cube. In the worked example the airflow had fallen about 9 %; recovering it needs about 10 % more speed, which by the same relationships costs roughly 32 % more fan power.
That is the best case. The fan also gets louder, the motor runs hotter, and the bearing life at the new speed is not the life that was quoted at the nominal one. If the fan was already close to its pressure limit, extra speed moves it towards the low-flow end of its curve, where the same fan produces more noise and less useful margin instead of a better result.
Mechanical changes usually pay better. More filter area lowers face velocity and the pressure drop together. Better sealing stops air from bypassing the media, which otherwise costs both the airflow and the filtration the filter was bought for. A smoother inlet and a shorter, straighter air path remove losses that no amount of speed can recover efficiently. Where the enclosure genuinely needs more pressure capability, the honest answer is a different fan rather than a faster setting on the old one.
Whichever route is chosen, the comparison has to be made at the same heat load and the same maintenance interval. Comparing a clean-filter airflow against a loaded-filter airflow is how a fan that looks adequate on paper ends up short in service.
| What changes with speed | How it scales | What it costs |
|---|---|---|
| Airflow | In proportion to speed | Nothing, until the limit is reached |
| Pressure capability | With the square of speed | Motor and bearing load |
| Shaft power | With the cube of speed | About 32 % more for the 10 % in the example |
| Broadband noise | Rises faster than the airflow gained | Must be re-checked against the acoustic limit |
| Bearing life | Falls as the speed rises | The quoted life applies at one speed only |
Readings to take during the test
A filter-loading test is cheap to run and expensive to get wrong, because a single missing reading usually means repeating it. The enclosure should be instrumented at the same points throughout, so the clean and loaded states are genuinely comparable.
Airflow should be measured where it can be, with the method stated, since an inlet-velocity traverse and a duct measurement give different answers and neither is a calibration. Filter pressure drop should be taken across the media itself, not across the whole cabinet, so the reading can be compared with the maker's curve. Component temperatures need to be logged at the critical devices and at the air inlet and outlet, on one clock.
| Reading to take | Instrument | Where it is measured | Why it matters |
|---|---|---|---|
| Filter pressure drop | Differential transducer | Across the media, both tappings clear of the frame | The only reading that can be compared with the maker's curve |
| Airflow | Hot-wire or vane anemometer, method stated | At the outlet or with a documented traverse | Converts the pressure reading into the airflow the load sees |
| Component temperature | Thermocouple or logged sensor | At the hottest device, not in the general air | The real limit that the alarm has to protect |
| Fan speed and current | Controller log, clamp meter | At the fan supply or the control interface | Shows whether speed compensation has already started |
| Input power | Power meter | At the fan supply, at the terminal | Exposes the energy cost of the restriction |
| Noise | Sound level meter, stated position | At the declared measurement point | Fixes the acoustic cost before a speed change is agreed |
What MEGA Tech can supply, and what we need from you
We are a custom cooling fan manufacturer. We select and build axial DC and EC cooling fans, and backward-curved centrifugal units where the pressure the coil or the filter demands is beyond what an axial fan can hold at that airflow. Selection is made against a stated duty - the airflow and the static pressure at that airflow - rather than against a part number, and we can supply a production-representative sample so the validation is done in your enclosure with your filter fitted, not on a free-air bench.
To quote a fan for a filtered enclosure we need the airflow and the static pressure at that airflow for the clean state and for the loaded state, together with the pressure-drop curve and the final pressure drop of the filter you intend to use. We also need the air temperature and altitude basis for the density correction, the supply voltage and its tolerance, the control, feedback and alarm interface you want, the connector and harness arrangement, the space and mounting available, the noise target and the point at which it is measured, the environment including dust and humidity, and the expected life with its assumptions.
Our scope ends at the cooling fan and its interface. We do not supply the filter media or the filter housing, the enclosure itself, the cabinet cooling unit or heat exchanger, the unit controller or its firmware, or the safety and ingress certification of the finished cabinet. Saying so is not a limitation we are hiding; it is what makes the quotation usable, because it makes clear which party is answering for which number.
We will not tell you a candidate is equivalent because the frame size matches. Two fans with the same 92 mm frame can differ by a factor in pressure capability at the airflow you need, and the comparison has to be made at the same pressure, the same speed and the same air density basis. That is the whole reason a filter-loading duty has to be written down before a fan is chosen.
Engineer FAQ: filters, pressure drop and cooling fans
The filter is part of the thermal system, not a dust accessory bolted to the outside.
Q: Why does airflow fall when a filter gets dirty? A: Loading raises the media resistance, so the system curve moves upward. The fan then reaches a new operating point with lower flow unless speed or pressure capability compensates.
Q: Can I use the clean pressure drop for the whole product life? A: No. Use the clean value for the initial condition and obtain a loaded or final value from the filter maker or from a representative loading test.
Q: How much airflow do I lose if the pressure drop rises by a third? A: It depends on the fan curve, not on the pressure alone. In the worked example in this article a rise from 180 Pa to 240 Pa cost about 9 % of the airflow on one fan curve and would cost more on a steeper one.
Q: Is a larger fan always the answer? A: Not necessarily. More filter area, better sealing, a lower face velocity or a different air path often reduce the resistance more cheaply. Compare the whole system at the real operating point.
Q: Can I just run the fan faster when the filter loads? A: You can, and the fan laws price it: in the example, recovering the lost airflow needed about 10 % more speed and about 32 % more power, with the acoustic and bearing consequences checked separately.
Q: How much airflow margin should be reserved? A: There is no universal percentage. Derive it from the loaded system curve, the heat-load tolerance, the shape of the fan curve, the control range, the power limit and the maintenance interval, then verify it with a representative sample.
Q: Does a higher filter class always mean worse cooling? A: Not on its own. The pressure drop depends on the media area and the face velocity as much as on the class, which is why a pleated or deeper element of the same class can be easier on the fan than a flat mat - and why the maker's curve matters more than the class letter.
Q: What should be included in a custom fan request for a filtered enclosure? A: Heat load, the filter pressure-drop curve, the clean and final pressure drop, the airflow target and the airflow at which it applies, the space available, the voltage, the noise limit, the operating pattern, the environment and the alarm or feedback signals required.
Questions for a design review
These are the questions that decide whether a filtered enclosure will still be cooling correctly in two years, and the ones worth putting in the minutes while the design can still change.
- Has the airflow target been stated together with the filter grade and the protection class, and at which airflow is it measured?
- Are the clean, loaded and final filter states all specified, with a pressure drop and an airflow for each?
- Does the fan curve cross the LOADED system curve above the airflow the electronics need?
- What pressure drop produces the airflow at which the critical component reaches its limit, and is the alarm threshold below it?
- Does the alarm combine pressure drop with speed and temperature, or does it rely on one fixed value?
- Has the speed compensation been checked for motor power, noise and bearing life at the maximum speed?
- Is the filter area as large as the enclosure allows, and is the face velocity stated?
- Will air bypass the media anywhere, through a seal, a cable gland or an unfiltered opening?
- What dust concentration exists at the installation, and what interval does that imply rather than the laboratory end point?
- Has anyone verified the loaded state on a real unit, rather than extrapolating from the clean one?